Category Archives: Environmental engineering

What Biochemical Oxygen Demand (BOD) Measures?

Biochemical oxygen demand (BOD) is a crucial parameter in assessing water quality and monitoring environmental health. In the field of wastewater treatment, understanding BOD in wastewater treatment is essential for evaluating how much organic matter exists in water bodies and the efficiency of purification processes. The BOD test measures the amount of oxygen that microorganisms consume while breaking down organic pollutants, providing a reliable indicator of organic pollution. Elevated BOD levels can signal excessive contamination, which can deplete dissolved oxygen and harm aquatic life.

By regularly conducting BOD measurement, experts can identify sources of water pollution, compare BOD vs COD (chemical oxygen demand), and implement effective strategies for sewage treatment. Ultimately, controlling biological oxygen demand is fundamental for protecting both public health and the environment.

What Biochemical Oxygen Demand measures are a question that all of us have in our minds while learning about water pollution. In this blog, I will walk you through Biochemical Oxygen Demand and, and its significance. The concept of Dissolved Oxygen is described in detail in the upcoming paragraphs.  In the next section, I will show you the complete details about what actually the Biochemical Oxygen Demand measures and BOD vs COD

  1. What does the Biochemical Oxygen Demand measure?
  2. Total Biological Oxygen Demand Measures
    1. Biological Oxygen Demand Measures of Drinking Water
    2. Factors affecting Biochemical Oxygen Demand
  3. Dissolved Oxygen (DO)
    1. Dissolved Oxygen Determination
    2. Calculation of Biochemical Oxygen Demand
    3. BOD5 vs BOD20
  4. BOD vs COD – Understanding Key Water Quality Indicators
  5. Key Takeaways
  6. Conclusion

What does the Biochemical Oxygen Demand measure?

Biological oxygen demand (BOD) measures the amount of oxygen that microorganisms require to break down organic matter present in a water sample. It also accounts for the chemical oxidation of some inorganic materials, both of which contribute to the overall depletion of dissolved oxygen. Typically, the BOD test expresses results in milligrams of oxygen consumed per litre over a 5-day incubation at 20°C, offering a reliable estimate of organic pollution in water.

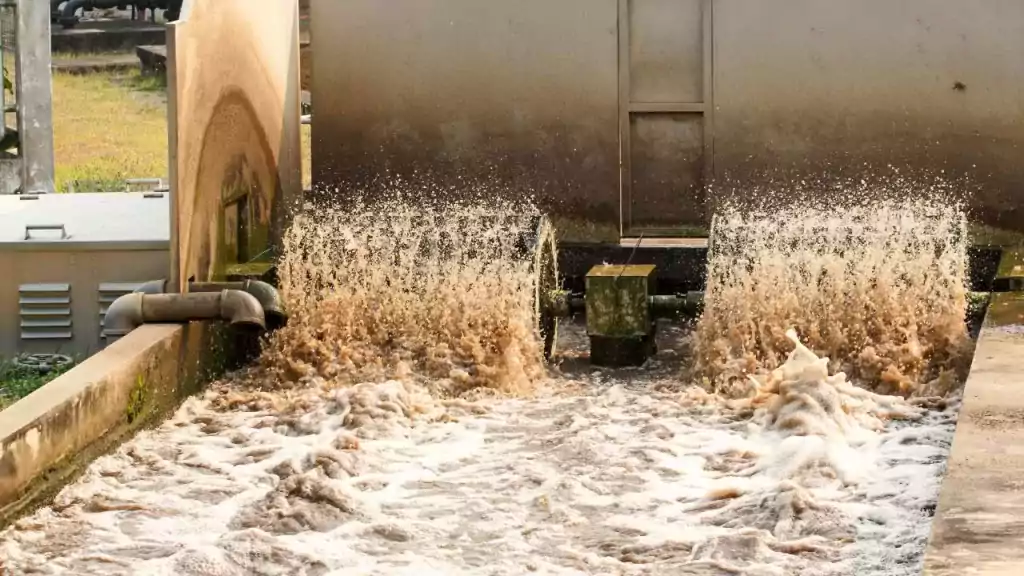
Monitoring BOD in wastewater treatment is essential for assessing the effectiveness of sewage treatment processes and ensuring optimal water quality. Major sources contributing to high BOD values include plant debris, animal waste, food-processing effluents, wastewater from pulp and paper mills, leachate from urban stormwater runoff, and poorly functioning septic systems. Reduction in biochemical oxygen demand is a key factor in evaluating successful wastewater treatment and protecting aquatic environments.

Biochemical Oxygen Demand in wastewater (BOD)
Biochemical Oxygen Demand in wastewater

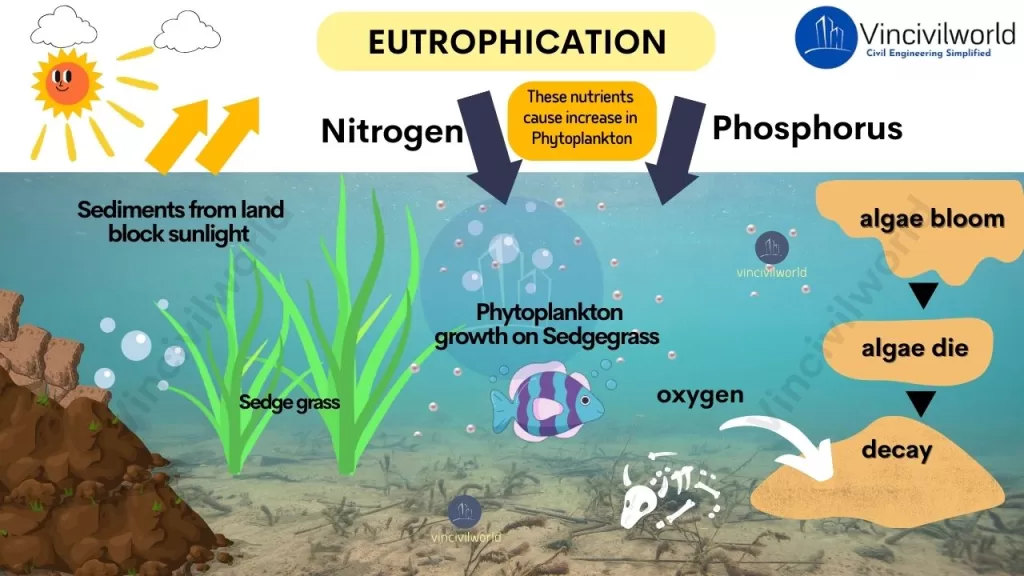
Biochemical Oxygen Demand has a direct effect on the amount of dissolved oxygen in rivers and streams. The higher the BOD, the faster the rate of oxygen depletion in the stream. This results in higher forms of aquatic life having less oxygen available to them. As a result, they suffocate, and eventually, die.

Total Biological Oxygen Demand Measures

Total biochemical oxygen demand is the quantity of oxygen necessary to totally oxidise organic substances to carbon dioxide and water over generations of microbial development, death, degradation, and cannibalism. It has a greater impact on food webs than water quality.

Biological Oxygen Demand Measures of Drinking Water

A water sample having a BOD5 between 1 and 2 mg/l indicates very pure water, 3.0 to 5.0 mg/l means moderately clean water and > 5 mg/l indicates a neighbouring pollution source. The biochemical oxygen demand of safe drinking water must be 1-2 mg/l.

Factors affecting Biochemical Oxygen Demand

Temperature, nutrient concentrations, aeration and the enzymes available to indigenous microbial populations affect the BOD measurements. For instance, rapids and waterfalls will speed up the decomposition of organic and inorganic material in stream water. As a result, BOD levels at a sampling location with slower, deeper waters may be higher for a given volume of organic and inorganic material than at a similar site in highly aerated waters.

Chlorine can interfere with the BOD measurements by preventing or killing the microorganisms that break down the organic and inorganic substances in a sample. Therefore, use sodium thiosulfate to neutralise the chlorine while sampling in chlorinated waters, such as those below a sewage treatment plant’s effluent.

Algae in the wastewater affect the Biochemical Oxygen Demand measures by releasing extra oxygen into the wastewater during photosynthesis. Hence, perform the BOD test in complete darkness. Before delving into Biochemical Oxygen Demand measures we should first understand the concept of Dissolved Oxygen (DO), its significance and its measurement.

Dissolved Oxygen (DO)

Aquatic plants and algae release oxygen into the water after performing photosynthesis in the presence of sunlight. The aquatic animals breathe this dissolved oxygen. Also, some oxygen from the atmosphere continuously dissolves into the water through reaeration. These three processes are in equilibrium and maintain the level of oxygen in water bodies at the required levels.

When organic substances or pollutants enter the waterbody, it disturbs the dissolved oxygen balance since microbes utilize dissolved oxygen in its breakdown. In other words, these organic substances exert a demand on the available dissolved oxygen.

Dissolved Oxygen - Aquatic plants
Dissolved Oxygen – Aquatic plants

The greater the oxygen necessary for its breakdown, the greater would be the reduction in the dissolved oxygen in the water body. Pollution occurs when the oxygen demand exceeds the dissolved oxygen availability.

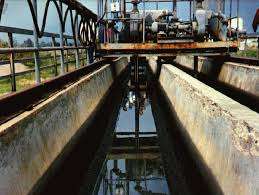
Also read: Wastewater Treatment- Stages and Process full details

Dissolved Oxygen Determination

Winkler’s method helps in determining the dissolved oxygen. The principle behind this method is the reaction between dissolved oxygen and manganese ions to precipitate out manganese dioxide.

Mn2+ + O2 —-> MnO2 

The manganese dioxide then reacts with iodide ions. This reaction liberates iodine in an amount chemically equivalent to the original dissolved oxygen.

MnO2 + 2I + 4H+ —-> Mn2+ + I2 + 2H2O

Titration with sodium thiosulphate gives the amount of iodine liberated and thereby the equivalent dissolved oxygen content. Thus we can measure the amount of Dissolved Oxygen in a given water sample.

Now, you have got a clear idea about Dissolved Oxygen. In the next section, I will show you the complete details about what actually the Biological Oxygen Demand measures.

Next, let’s see the procedure to obtain the Biochemical Oxygen Demand measures.

Calculation of Biochemical Oxygen Demand

We require two samples from a location to measure Biochemical Oxygen Demand. One is immediately tested for dissolved oxygen, while the other is incubated in the dark at 20o Celsius for 5 days before being examined for the residual dissolved oxygen. 

Let me show you the detailed procedure.

  1. Fill two standard 300-ml BOD bottles with the sample wastewater. Seal the bottles properly.
  2. Immediately determine the dissolved oxygen content of one of the samples using Winkler’s method.
  3. Incubate the second bottle at 20 0C for 5 days in complete darkness.
  4. Determine the DO levels after 5 days.

The amount of BOD is the difference in oxygen levels between the first and second tests, measured in milligrams per litre (mg/L). This is the amount of oxygen that the microorganisms require throughout the incubation period to break down the organic materials in the sample container.

DO (mg/L) of first bottle – DO (mg/L) of second bottle = BOD (mg/L)

The dissolved oxygen level may be nil at the end of the 5-day incubation period. This is particularly the case for rivers and streams which have a high pollution load of organic matter. Moreover, it is impossible to determine the BOD level because it is unknown when the zero point was reached. In this situation, dilute the original sample by a factor that yields a final dissolved oxygen content of at least 2 mg/L. The dilutions should be done with special dilution water of high purity.

The dilution water consists of deionised water with sufficient nutrients, phosphate buffer, trace elements and seed organisms (mostly settled domestic sewage). Perform a blank run on this dilution water and subtract its oxygen demand from the results.

BOD5 (mg/l) = D* [(DOt=0 – DOt=5)]sample – [(DOt=0 – DOt=5)]blank

BOD5 vs BOD20

During the standard 5-day/20 0Celsius conditions, about two-thirds of the carbonaceous material undergoes degradation. In the 5-day test, compounds that aren’t easily biodegradable or soluble don’t undergo complete digestion. Incubation of 5 days gives the soluble BOD or BOD5 measures while that of 20 days gives Ultimate Biochemical Oxygen Demand measures or BOD20

Biochemical Oxygen Demand

It requires nearly 20 days for the complete breakdown. On the other hand, the 20-day Biochemical Oxygen Demand measures greater long-term oxygen demand from insoluble materials including cellulose, long-chain fatty acids, and grease. Always keep in mind that COD > BOD20 > BOD5.

In spite of its limitations, Biochemical Oxygen Demand analysis has wide applications in monitoring pollution. These days, Chemical Oxygen Demand analysis is gaining wide popularity for research and plant control.

BOD vs COD – Understanding Key Water Quality Indicators

Biochemical Oxygen Demand (BOD) and Chemical Oxygen Demand (COD) are critical indicators for water quality assessment. BOD measures the amount of oxygen that microorganisms need to biologically break down organic matter in water, reflecting the level of biodegradable organic pollution. In comparison, COD quantifies the total oxygen required to chemically oxidize both organic and inorganic substances, providing a broader measure of all oxidizable pollutants. BOD is determined by incubating a water sample for five days, while COD uses strong oxidizing agents for a faster result. COD values are always higher than BOD because COD includes both biodegradable and non-biodegradable materials. Monitoring both parameters is essential in wastewater treatment to evaluate pollution levels and treatment efficiency

Key Takeaways

  • Biochemical Oxygen Demand (BOD) measures the amount of dissolved oxygen microorganisms need to decompose organic matter in water, indicating the level of organic pollution.
  • BOD is determined by measuring oxygen levels before and after a 5-day incubation period at 20°C to assess microbial activity and organic load.
  • High BOD values signal greater organic pollution, leading to depleted dissolved oxygen and potentially harming aquatic life, including fish kills.
  • Controlling BOD is essential in wastewater treatment to ensure discharged water meets environmental standards and sustains aquatic ecosystems.
  • Main sources of high BOD include sewage, industrial effluents, plant debris, animal waste, stormwater runoff, and failing septic systems.
  • Dissolved Oxygen (DO) levels are inversely related to BOD; higher BOD reduces DO, affecting water quality.
  • BOD vs COD: While BOD measures biologically oxidizable matter, COD includes both biodegradable and non-biodegradable substances; COD values are typically higher and tests are faster.
  • BOD testing is a standard practice in monitoring and regulating water and wastewater treatment plant performance.
  • BOD is expressed in milligrams per litre (mg/L), enabling clear comparison and assessment of water samples’ pollution levels.
  • Both BOD and COD are critical for understanding water pollution and ensuring effective environmental management.

Conclusion

Biochemical Oxygen Demand (BOD) is a fundamental indicator used to gauge the organic pollution in water by quantifying the amount of oxygen required for microbial decomposition. Regular measurement of BOD is essential for environmental health, as it helps identify pollution sources and assess the effectiveness of wastewater treatment systems. High BOD levels are directly linked to reduced dissolved oxygen, which can endanger aquatic organisms and disrupt ecosystem balance. Comparison with Chemical Oxygen Demand (COD) complements this analysis by accounting for total oxidizable substances both biodegradable and non-biodegradable providing a comprehensive picture of water quality. Effective BOD control supports the protection of natural waterbodies and public health, highlighting its critical role in environmental monitoring and water resource management

That’s it about Biochemical Oxygen Demand. Hope you found it insightful. Let us know your queries in the comments.

Eutrophication – Definition, Causes, Effects and Control

Eutrophication is a natural process in water bodies that becomes problematic when accelerated by human activities. It is caused by the excessive accumulation of nutrients, particularly nitrogen and phosphorus, leading to algal blooms and oxygen depletion. This phenomenon, also known as cultural eutrophication, occurs when agricultural runoff, wastewater discharge, and industrial effluents introduce pollutants into water systems. The cause of eutrophication is primarily linked to nutrient overloading, which fosters the growth of algae, eventually causing harm to aquatic ecosystems. The process of eutrophication disrupts aquatic life, while its effects include loss of biodiversity, poor water quality, and fish mortality. Understanding eutrophication causes and effects is crucial for managing its impact. In simple terms, eutrophication explained involves the imbalance caused by excess nutrients in aquatic systems.

Eutrophication in US freshwaters costs approximately $2.2 billion per year. Astonishing, right? Want to know more about this process that can wreak havoc if left unchecked? In this blog, let’s visit a eutrophied lake and understand the entire events that lead to eutrophication and its effects.

Let’s dive in.

  1. What Is Eutrophication?
  2. Eutrophication Process
  3. Types of Eutrophication
    1. Natural Eutrophication
    2. Cultural Eutrophication
  4. Eutrophication Effects
    1. Loss of Biodiversity
    2. Harmful Algal Blooms (HABs)
    3. Monetary Loss
  5. Eutrophication Control Measures
  6. Key Takeaways
  7. Conclusion

What Is Eutrophication?

Eutrophication refers to the process of nutrient over-enrichment in water bodies. It involves primarily nitrogen and phosphorus. This leads to excessive algal and plankton growth. This phenomenon, often termed cultural eutrophication, occurs due to human activities such as agricultural runoff and fertilizer use. Eutrophication explained highlights that this process reduces dissolved oxygen levels, causing poor water quality and threatening aquatic ecosystems.

The cause of eutrophication is primarily linked to artificial fertilizers and untreated waste discharge. As algae bloom, oxygen depletion follows, creating “dead zones” incapable of supporting life. This causes both environmental and ecological harm, ranking alongside global warming and deforestation. Understanding eutrophication meaning involves addressing the causes of eutrophication like synthetic fertilizers and urban runoff. The effects of eutrophication include biodiversity loss and water quality degradation, making it a critical issue in environmental management.

Also check out : Wastewater Treatment- Stages and Process full details.

In the next section, I will show you how a water body undergoes eutrophication.

Eutrophication Process

  • Soil receives nutrients in excess from synthetic fertilizers. Surface runoff washes them away into the water body.
  • Nutrients reach the water body via untreated sewage and industrial effluents too.
  • Excess nutrients cause accelerated growth of algae or algal bloom.
  • Light penetration reduces due to the algal bloom.
  • Plants beneath the algal bloom perish because they are unable to perform photosynthesis in the absence of sunshine.
  • The algal bloom eventually dies and settles to the lake’s bottom.
  • Bacterial populations begin to break down the remnants, consuming oxygen in the process.
  • Oxygen is lost in the water as a result of decomposition.
  • Aquatic organisms die due to a lack of dissolved oxygen. The waterbody turns into a dead zone which doesn’t support life.
Eutrophication Process

Types of Eutrophication

Based on the source of nutrient enrichment, there are two types of eutrophication. They are:

Natural Eutrophication

Although human activities are the most prevalent cause of eutrophication, it can also be a natural process, especially in lakes. Due to climate change, geology and other external factors, the nutrient density of a water body increases over time and undergoes the process of natural eutrophication.

A few lakes also show the reverse process called meiotrophication. In this process, nutrient-poor inputs make the lake less nutrient-rich over time. Artificial lakes and reservoirs usually undergo this process, which starts out as very eutrophic but eventually become oligotrophic. An oligotrophic lake is a lake with low primary productivity due to low nutrient content.

The major difference between natural and anthropogenic eutrophication lies in the timescale. The former takes geologic ages to complete while the latter is a quick process.

Cultural Eutrophication

Eutrophication caused by human activity is also known as cultural or anthropogenic eutrophication. It is a process that accelerates natural eutrophication. Land runoff increases as a result of the land clearing and construction of towns and cities. Therefore, surface runoff from croplands carry nutrients such as phosphates and nitrate into the lakes and rivers, and then to coastal estuaries and bays.

When excess nutrients from anthropogenic sources such as runoff from fertilised croplands, lawns, and golf courses, untreated sewage and wastewater end up in water bodies, they cause nutrient pollution and simultaneously speeds up the natural process of eutrophication. The degradation of water quality induced by cultural eutrophication severely impacts human uses such as potable water, industrial usage, and recreation.

Let’s move on to the section describing its effects or consequences.

Eutrophication Effects

The effects of eutrophication range from ecological losses to economical losses. Let’s have a closer look at each one of them.

Loss of Biodiversity

Aquatic environments support a diverse range of plant and animal life. The process of eutrophication disrupts the ecosystem’s balance by promoting the growth of basic plant life. The ecosystem’s biodiversity is drastically reduced as a result of the loss of some desirable species.

The most noticeable consequence of cultural eutrophication is the formation of dense blooms of toxic, foul-smelling blue-green algae or cyanobacteria that impairs water clarity and quality. Algal blooms reduce light penetration. This limits aquatic plant growth and diminishes the success of predators that rely on light to hunt and catch prey in the benthic zone. Eventually, it leads to the mass death of aquatic plants and organisms.

Furthermore, eutrophication’s high rates of photosynthesis drain dissolved inorganic carbon and elevate pH to dangerously high levels throughout the day. By diminishing chemosensory skills, elevated pH can ‘blind’ organisms that use the sense of dissolved chemical cues for survival.

When the dense algal blooms die, microbial breakdown depletes dissolved oxygen, resulting in a hypoxic or anoxic “dead zone” where most species are unable to survive. Many freshwater lakes contain dead zones. Eutrophication-induced hypoxia (extremely low oxygen concentrations in bottom waters) and anoxia pose a danger to profitable commercial and recreational fisheries around the world.

Eutrophication effects

Harmful Algal Blooms (HABs)

Some algal blooms are also dangerous because they produce toxins like microcystin and anatoxin-a. Harmful algal blooms (HABs) leads to:

  • water quality degradation
  • the extinction of commercially important fishes 
  • public health problems 

Toxic cyanobacteria such as Anabaena, Cylindrospermopsis, Microcystis, and Oscillatoria (Planktothrix) dominate nutrient-rich, freshwater systems due to their superior competitive abilities under high nutrient concentrations, low nitrogen-to-phosphorus ratios, low light levels, reduced mixing, and high temperatures.

Algal Blooms
Algal Blooms

Toxic cyanobacteria bloom causes poisonings of domestic animals, wildlife, and even humans all around the world. For instance, shellfish poisoning is a result of HABs. Shellfish ingests the biotoxins produced during algal blooms. When humans consume them, it leads to various kinds of poisoning including paralytic, neurotoxic, and diarrhoetic shellfish poisoning.

Ciguatera, a predator fish becomes a vector for such toxins by accumulating the poison in its body and then poisoning the humans who consume it. Furthermore, cyanobacteria are responsible for various off-flavour compounds (such as methyl isoborneol and geosmin) detected in municipal drinking water systems.

Monetary Loss

Due to the continuous feeding of the fish, aquaculture ponds often accumulate high concentrations of nutrients such as nitrogen and phosphorus. As a result, these ponds are subjected to cyanobacterial blooms and hypoxia regularly. aquaculture-reared fish, resulting in significant financial losses.

Eutrophication also lowers the recreational value of rivers, lakes, and beaches. This severely impacts the tourism sector. When eutrophic conditions interfere with the treatment of drinking water, health concerns and monetary losses arise.

OK, I know what you’re thinking. How to control eutrophication, right? Read on to find more.

Eutrophication Control Measures

  • Prevent the flow of plant nutrients to water bodies. Reduce the overuse of synthetic fertilizers.
  • Proper channelling of agricultural wastes and runoffs.
  • Releasing only safe and treated effluents to water bodies.
  • Seaweed cultivation absorbs nitrogen and phosphorous and removes excess nutrients.
  • Promoting the growth of shellfish.

That’s it about eutrophication. Hope you found it useful.

Key Takeaways

Eutrophication is a nutrient enrichment process in water bodies, primarily caused by nitrogen and phosphorus. While natural eutrophication takes centuries, cultural eutrophication accelerates due to human activities like agricultural runoff and untreated wastewater. This leads to algal blooms, oxygen depletion, and the formation of hypoxic or “dead zones,” harming aquatic ecosystems. Key effects include biodiversity loss, harmful algal blooms (HABs), water quality degradation, and economic losses in fisheries and recreation. Addressing eutrophication requires reducing nutrient pollution from fertilizers and industrial effluents. Understanding this process and its impacts is crucial for effective environmental management.

Conclusion

Eutrophication, whether natural or cultural, poses significant ecological and economic challenges. Cultural eutrophication, driven by human activities, intensifies nutrient pollution, causing harmful algal blooms and oxygen-depleted waters. The resulting biodiversity loss and water quality degradation lead to habitat destruction and economic losses, such as reduced fisheries and recreational opportunities. Combating eutrophication demands action, including limiting nutrient runoff, improving wastewater treatment, and promoting sustainable agricultural practices. By addressing these causes, we can mitigate the adverse effects on aquatic ecosystems and preserve water resources. Understanding eutrophication is key to safeguarding our environment and ensuring long-term ecological balance.

Sustainable Cities and communities – The future essentials

Sustainable cities and communities are gaining popularity due to rapid urbanization, population growth, and pollution. They aim to achieve environmental, social, and economic sustainability for current populations without compromising the ability of future generations to do the same. According to the 2018 Revision of World Urbanization Prospects, 68% of the global population is projected to live in urban areas by 2050, with this figure expected to rise. In this blog, we will explore the concept of sustainable cities and society, examine a sustainable city model, and discuss their features, as well as the reasons for their growing prominence.

  1. What are Sustainable Cities and Communities ?
    1. Sustainable city – Definition and Key features
    2. Sustainable community -Definition and Importance
  2. Importance of Sustainable City model
  3. Sustainable City Model – Benefits
  4. Features of Sustainable Cities
    1. Urban Agriculture and Urban Forests
      1. Contribution of Urban Farming in a Sustainable City
    2. Sustainable Transportation
      1. Car-free Cities
      2. Urban Proximity
    3. Energy Conservation
    4. Green Buildings
    5. Effective Waste Management Strategies
    6. Recycling and Circular Economy Practices
      1. Recycling
      2. Circular Economy Practices
  5. Economic Benefits of sustainable city model
    1. Economic Advantages of Sustainable Cities
    2. Business Opportunities in Sustainable Development
  6. Challenges and Solutions of Sustainable Cities
    1. Challenges
    2. Solutions
    3. Sustainable Cities of the World
  7. The Future Outlook for Sustainable Cities and Communities
  8. Call to Action for Creating a Sustainable Future
  9. Conclusion

What are Sustainable Cities and Communities ?

Sustainable cities and communities are those that are dedicated to achieving environmental, social, and economic sustainability for existing populations. However, the concept doesn’t put at risk the ability of future generations to have the same experience. We will go through the definition of each of the terms.

  • Sustainable Cities
  • Sustainable communities

Sustainable city – Definition and Key features

A sustainable city balances environmental, social, and economic needs. This aims to provide residents with a high quality of life while safeguarding resources for future generations.

Key features of sustainable cities include efficient public transport, renewable energy sources, ample green spaces, and robust waste reduction programs. Generally, these cities prioritize economic opportunities alongside social equity. They focus on minimizing energy usage, conserving water, and optimizing food production. Additionally, they aim to drastically reduce waste and heat emissions while lowering carbon footprints through sustainable practices.

Sustainable Cities and Communities

Urban planning integrates smart technology and innovative design to build resilient infrastructure. This basically ensures long-term environmental health, economic prosperity, and social well-being for all residents.

Sustainable community -Definition and Importance

Sustainable communities are essential for our future. Together, they ensure that we meet our needs today without compromising the ability of future generations to meet theirs. Here’s why they matter:

  • Environmental Impact: Sustainable practices reduce waste and preserve natural resources. Consequently, they contribute to mitigating climate change.
  • Public Health: Clean air, water, and energy sources improve community well-being. Additionally, they reduce healthcare costs and enhance quality of life.
  • Active Transportation: Walking and biking options reduce pollution and promote health. Moreover, they ease traffic congestion and enhance urban livability.
  • Renewable Energy: Using solar and wind power lowers greenhouse gas emissions. Consequently, it supports energy independence and reduces reliance on fossil fuels.
  • Local Economy: Supporting local businesses and agriculture boosts economic resilience. Furthermore, it fosters community pride and enhances economic diversity.
  • Social Equity: Access to affordable housing, healthcare, and education for all ensures fairness and opportunity. Additionally, it reduces disparities and promotes inclusive growth.
  • Resilience: Collaborative efforts build strong communities prepared for challenges. Therefore, they enhance disaster preparedness and community cohesion.

“Together, these elements create neighborhoods that are not only environmentally friendly but also socially and economically robust, ensuring a sustainable and equitable future.”

Now that we’ve explored sustainable cities and communities, let’s delve into why they are essential.

Importance of Sustainable City model

According to the UN Environment Programme, contemporary cities grapple with several critical challenges. Basically, these include

  • Environmental degradation
  • Traffic congestion
  • Insufficient urban infrastructure
  • Shortage of basic services such as water supply and sanitation
  • Waste management

Despite covering a mere 3% of the Earth’s land, cities consume 60 to 80% of global energy and produce over 70% of carbon emissions. Consequently, prioritizing the development of clean, resilient, and sustainable cities stands as a paramount goal within the UN Sustainable Development Agenda.

By addressing these challenges through innovative urban planning, renewable energy adoption, and enhanced infrastructure, cities can mitigate their environmental footprint while improving the quality of life for residents. This approach not only promotes a sustainable city model but also contributes to global efforts in combating climate change and fostering equitable economic growth.

Sustainable City Model – Benefits

  • A sustainable city model encourages economic development and meets the basic needs of its residents while also ensuring that all residents live in safe and healthy environments.
  • A sustainable city model provides a long-term way of life in all four domains: ecology, economics, politics, and culture and can solve all the problems faced by modern-day cities.
  •  Richard Florida, an urban studies theorist, focuses on the social effect of sustainable cities, stating that cities should foster a great people environment that appeals to individuals and families of all sorts, rather than just a competitive business climate.
  • As a result, a transition to a sustainable urban living will provide a venue for social interaction and create conditions conducive to human flourishing.
  • Sustainable city model will also encourage the use of public transportation, walkability, and biking, both of which would improve both residents’ health and the environment.

Let’s go for a trip through a sustainable city and learn its features.

Features of Sustainable Cities

“Sustainable urban planning focuses on principles that enhance livability and resilience in cities:

  • Urban Agriculture and Urban Forests
  • Sustainable Transportation
  • Energy Conservation
  • Green Buildings
  • Effective Waste Management Strategies
  • Recycling and Circular Economy Practices
  • Mixed Land Use
  • Community Engagement

These principles aim to create cities that are environmentally sustainable, socially inclusive, and economically vibrant, meeting the needs of current and future generations.”

Urban Agriculture and Urban Forests

Urban agriculture is the method of growing and distributing food, as well as raising livestock, in and around a city or urban areas. It strongly links and depends on the urban ecosystem in the following ways:

  • Use of urban residents as key workers 
  • Use of typical urban resources (such as organic waste as compost or urban wastewater for irrigation)
  • Direct links with urban consumers
  • Direct impacts on urban ecology (both positive and negative)
  • Being a part of the urban food system
  • Being influenced by urban policies and plans are all examples of such linkages.
Urban forest of Sustainable cities

Let’s have a look at how urban farming contributes in making a city sustainable.

Contribution of Urban Farming in a Sustainable City

  • Energy used to transport food is decreased when urban agriculture can provide cities with locally grown food.
  • Urban agriculture’s energy-efficient design will minimise each city’s carbon footprint thereby reducing the amount of transportation required to deliver goods to consumers. 
  • Mostly, such areas can serve as carbon sinks, absorbing some of the carbon that urban areas naturally accumulate. 
  • Produce grown in urban gardens is often thought to be more flavorful and appealing than produce purchased in stores. 
  • Increased consumption of fruits and vegetables is linked to a lower risk of disease, and urban agriculture. Generally, this can be a cost-effective way to provide residents with fresh produce in urban areas.

Sustainable Transportation

Sustainable transportation aims to create a more environmentally responsible and socially equitable urban core. This altogether reduces a city’s dependence and use of greenhouse gases by combining

  • Eco-friendly urban development
  • Low-emission cars
  • Residential proximity

Basically, transportation networks currently account for about a quarter of global energy consumption and CO2 emissions. Since transportation services have such a large effect on a city’s energy use, planning experts have placed a greater focus on sustainable transportation in the last decade. Some of the key areas of focus are:

Car-free Cities

  • Car-free cities or cities with significant pedestrian areas are often included in the design of a sustainable city.
  • The car-free idea is often considered an important part of the design of a sustainable city.
  • Following the COVID-19 lockdown, large areas of London will be made car-free to enable people to walk and cycle safely.
Car free cities of sustainable cities

Urban Proximity

  • Urban proximity necessitates the construction and expansion of cities with sufficient population and landmark density so that destinations can be reached in less time.
  • This reduced time in transit reduces fuel consumption and makes alternative modes of transportation, such as biking and walking, more available.

Energy Conservation

Sustainable cities prioritise the use of renewable energy sources to reduce and manage emissions. Renewable energy is the energy obtained from sources that are naturally replenished on a human time scale such as wind turbines, solar panels, or bio-gas generated from sewage.

Sustainable cities  minimise the need for air conditioning (a huge energy demand) by:

  • Planting trees 
  • Lightening surface colours
  • Using natural ventilation systems 
  • Creating green spaces covering at least 20% of the city’s surface 
  • These interventions combat the “heat island effect” caused by an excess of tarmac and asphalt, which can make urban areas several degrees warmer than rural areas—up to six degrees Celsius in the evening. 
Green Roof : Sustainable cities
  • Green roofs help to reduce the urban heat island effect by altering the surface energy balance. However, Air quality, environment, and water runoff are all benefited from incorporating eco-roofs or green roofs in sustainable cities.
  • Sustainable cities also adopt xeriscaping, rainwater harvesting, hydroponics etc for water conservation. 

Green Buildings

Sustainable Cities promote LEED-certified green buildings. LEED, or Leadership in Energy and Environmental Design, is a green building certification scheme that is used all over the world. A building may have a variety of features that make it “green.” Let’s have a look at some of them:

  • Power, water, and other resources are used more efficiently.
  • Use of renewable energy sources.
  • Steps to reduce pollution and waste, as well as the facilitation of re-use and recycling.
  • Satisfactory indoor air quality.
  • Non-toxic, ethical, and long-lasting products are used.

Effective Waste Management Strategies

Effective waste management aims to reduce environmental impact and conserve resources. Key strategies include:

  • Recycling: Convert waste into reusable materials.
  • Composting: Turn organic waste into valuable soil amendments.
  • Circular Economy Practices: Design products for durability, reuse, and recycling.
  • Waste Segregation: Ensure hazardous and non-recyclable waste is disposed of safely.
  • Public Awareness and Education: Promote sustainable waste practices through campaigns.

Recycling and Circular Economy Practices

Recycling

  • Material Recovery: Collect and process waste materials to create new products, thereby reducing the need for virgin resources.
  • Waste Reduction: Decrease the amount of waste sent to landfills by reusing materials.
  • Energy Savings: Manufacturing products from recycled materials often requires less energy than producing them from new materials.
  • Environmental Protection: Reduces pollution and conserves natural resources by limiting the extraction and processing of raw materials.

Circular Economy Practices

  • Product Design: Create products with longer life spans, easy repairability, and recyclability to minimize waste.
  • Resource Efficiency: Maximize the use of resources by keeping them in use for as long as possible through reuse, remanufacturing, and recycling.
  • Waste as a Resource: Treat waste as a resource to be recovered and reused, rather than discarded.
  • Sustainable Business Models: Implement models like leasing, sharing, and product-as-a-service to reduce the need for new products and encourage efficient resource use.
  • Lifecycle Thinking: Consider the environmental impact of products throughout their entire lifecycle, from production to disposal.

Economic Benefits of sustainable city model

Sustainable cities provide economic benefits by enhancing efficiency, creating jobs, reducing costs, attracting investment, and improving property values.

Economic Advantages of Sustainable Cities

  • Increased Efficiency: Sustainable cities optimize resource use, thereby reducing waste and costs.
  • Job Creation: Green industries and technologies create new employment opportunities.
  • Health Benefits: Improved air and water quality reduce healthcare costs and increase productivity.
  • Attracting Investment: Sustainability initiatives draw investors seeking eco-friendly projects.
  • Enhanced Property Values: Green infrastructure and amenities boost property desirability and values.
  • Cost Savings: Energy-efficient buildings and public transport reduce utility and transportation costs for residents and businesses.

Business Opportunities in Sustainable Development

  • Renewable Energy: Invest in solar, wind, and other renewable energy sources.
  • Green Construction: Develop eco-friendly buildings and infrastructure.
  • Waste Management: Innovate in recycling, composting, and waste-to-energy solutions.
  • Sustainable Agriculture: Promote organic farming, urban agriculture, and sustainable food systems.
  • Eco-Tourism: Create experiences that highlight natural beauty and conservation efforts.
  • Sustainable Products: Develop and market products made from recycled or sustainable materials.
  • Consulting Services: Offer expertise in sustainability practices to businesses and governments.

Challenges and Solutions of Sustainable Cities

Challenges

  1. High Initial Costs: Implementing sustainable infrastructure requires significant upfront investment.
  2. Public Awareness: Limited understanding and support for sustainable practices among residents.
  3. Regulatory Barriers: Outdated laws and policies that hinder sustainable development.
  4. Urban Planning Complexity: Integrating new technologies into existing infrastructure poses challenges.

Solutions

  1. Public-Private Partnerships: Share costs and risks between government and private sectors.
  2. Incentives and Subsidies: Offer tax breaks and financial support to encourage sustainability.
  3. Education and Awareness Campaigns: Inform and engage the public on the benefits of sustainability.
  4. Policy Reform: Update regulations to facilitate the adoption of sustainable technologies.
  5. Best Practice Adoption: Learn from successful global examples and tailor solutions locally.
  6. Community Engagement: Involve residents in decision-making to ensure buy-in and effectiveness.

Sustainable Cities of the World

  1. Adelaide – Australia
  2. Bafut – Cameroon
  3. Victoria – Canada
  4. Vancouver – Canada
  5. Tianjin – China
  6. Turku – Finland
sustainable city - Adelaide
sustainable city – Adelaide

The Future Outlook for Sustainable Cities and Communities

The future of sustainable cities and communities holds promise amidst ongoing challenges. Generally, as urbanization accelerates globally, the imperative to embrace sustainability becomes ever more critical. Sustainable practices not only mitigate environmental impact but also enhance economic resilience, improve public health, and foster inclusive growth. By investing in renewable energy, efficient infrastructure, and smart urban planning, cities can reduce carbon footprints while creating vibrant, livable spaces for residents. Collaboration between governments, businesses, and communities is essential to overcome financial barriers and regulatory hurdles.

Call to Action for Creating a Sustainable Future

To build sustainable cities and communities, stakeholders must act decisively. However, governments should prioritize policies that incentivize green technologies and urban planning strategies. Businesses can innovate sustainable solutions and adopt responsible practices. Communities must engage actively, advocating for sustainable development in local decision-making processes. Educational initiatives should promote awareness and empower individuals to adopt eco-friendly behaviors. However, by integrating these efforts, we can transform urban landscapes into resilient, inclusive, and environmentally conscious hubs that meet the needs of current and future generations. Generally, embracing sustainability today ensures a brighter and healthier tomorrow for all.

Conclusion

  • To sum up, Sustainable cities are those that address the social, economical and environmental aspects of sustainability by adopting urban farming, sustainable transportation, conserving energy, reducing emissions and pollution and promoting green buildings.
  • Sustainable cities aren’t merely a lofty target for urban planners and environmentalists, however, they are essential in the fight against climate change.
  • Flooding, heat waves, contaminated water sources, and other disasters can all be mitigated with sustainable infrastructure.
  • Moreover, disease spread can be reduced or eradicated through smart, sustainable urban planning, as demonstrated during the coronavirus pandemic.
  • Generally, cities that decrease their vulnerability to climate change and other natural disasters will face fewer property damage, insurance losses, and fatalities, making sustainable urban practices vital for long-term success.

Constructed Wetlands for Wastewater Treatment

Constructed wetlands are wastewater treatment systems that utilise natural processes such as plants, soil, and organisms to treat wastewater, greywater, or stormwater runoff from municipal or industrial sources. In this blog, let’s go for a trip exploring the different types of constructed wetlands and their mechanism.

Let’s get started by understanding the basics of a constructed wetland.

  1. What are constructed wetlands?
  2. Constructed Wetlands Components
  3. Pollutants Removal In Constructed Wetlands
    1. Nitrogen Removal
    2. Phosphorus Removal
  4. Constructed Wetlands Types
    1. Subsurface Flow Wetlands
      1. Horizontal Flow Constructed Wetlands
      2. Vertical Flow Constructed Wetlands
    2. Surface Flow Wetlands
  5. Floating treatment wetlands
  6. Conclusion

What are constructed wetlands?

Constructed wetlands are manmade wetlands that find applications in land reclamation after mining and compensating for natural areas lost to development. They operate as a biofilter and remove a variety of pollutants from the water such as organic substances, fertilisers, pathogens, and heavy metals. It can also eradicate pathogens (bacteria, viruses, protozoa, and helminths) to a certain extent.

Constructed Wetlands Components

There are three main components in constructed wetlands:

  • An impermeable layer of Clay
  • A Substrate layer of gravel
  • Ground Vegetation Zone

The impermeable layer, which is often comprised of clay, inhibits pollutants from filtering into the lower aquifers. It is the bottom-most layer.

Above the impermeable layer lies the substrate layer. that nourishes and protects the root zone. The water passes through this layer and into the root zone. Bioremediation and denitrification take place in this layer with the help of bacteria present in the roots. The ground vegetative layer rests above the substrate layer.

Constructed wet lands

In a wetland, vegetation offers a substrate (roots, stems, and leaves) for microbes to proliferate as they decompose organic matter. This microbial colony or the periphyton accomplishes around 90% of pollution removal and waste decomposition. When the plants degrade, they provide a carbon source for the microorganisms and eliminate roughly 7% to 10% of contaminants.

Also read : Secondary Treatment for Wastewater – Methods and Process

Pollutants Removal In Constructed Wetlands

  • As wastewater flows through the wetland medium and the plant rhizomes, it undergoes treatment through various physical, chemical and biological processes.
  • The oxygen which comes out of the rhizomes, roots, and rootlets, forms a thin layer surrounding each root hair.
  • This creates aerobic conditions for the aerobes to act. Along with the aerobic bacteria, anaerobic bacteria also acts on the wastewater.
  • Microbial nitrification and subsequent denitrification releases nitrogen gas. In the root-bed media, phosphorus coprecipitates with iron, aluminium, and calcium compounds.
  • Filtration and adsorption by biofilms on the gravel or sand media reduces the harmful bacteria and viruses.

Nitrogen Removal

Ammonia present in the wastewater converts to ammonium ions. The aerobic bacterium Nitrosomonas sp. oxidizes these ammonium ions to nitrite. Nitrite converts to nitrate by the action of the the bacterium Nitrobacter sp. Finally, nitrate reduces to relatively harmless nitrogen gas under anaerobic conditions. It then enters the atmosphere.

Phosphorus Removal

Phosphorus removal and storage occurs within the constructed wetland itself since the phosphorus cycle is closed and there is no release of it into the atmosphere. A wetland system sequesters phosphorus by:

  1. Incorporating phosphorus into living biomass and thereby becoming a part of the organic matter present in living beings.
  2. Precipitation of phosphorus as insoluble phosphates with ferric iron, calcium, and aluminium compounds found in wetland soil.

Constructed Wetlands Types

The following are the three primary types of built wetlands:

  • Subsurface flow constructed wetland
  • Surface flow constructed wetland
  • Floating treatment wetland

Let’s have a closer look at each one of them.

Subsurface Flow Wetlands

There is no water surfacing in subsurface flow constructed wetlands because wastewater flows through the roots of the plants which lies below the gravel. As a result, these types of constructed wetlands offer the following advantages:

  • The system is more efficient
  • Attract fewer mosquitoes and flies.
  • Emit less stink.
  • Less susceptible to cold temperatures.
  • Water purification takes up lesser space.

There are two types of subsurface flow constructed wetlands: Horizontal flow and vertical flow constructed wetlands

Horizontal Flow Constructed Wetlands

The effluent in the horizontal flow built wetland moves horizontally and parallel to the surface. Absence of surface water, preventing mosquito breeding. Subsurface flow wetlands can treat a variety of different wastewaters, such as household wastewater, agricultural, paper mill wastewater, mining runoff, tannery or meat processing wastes, stormwater.

Vertical Flow Constructed Wetlands

A vertical flow constructed wetland is a planted filter bed with a bottom drain. A mechanical dosing system pours or doses wastewater onto the surface from above. Water runs down vertically through the substrate layer to the basin’s bottom, where it is collected in a drainage pipe. In comparison to horizontal flow constructed wetlands, vertical flow constructed wetlands are more efficient and use less space.

Also read : Activated Sludge Process – Stages and Process Control

Surface Flow Wetlands

Surface flow wetlands resemble wastewater treatment ponds in appearance such as “waste stabilisation ponds”. They find applications in tertiary treatment, wastewater treatment plant effluent polishing and stormwater runoff treatment

Along with natural decay, predation by higher species, pathogens die by UV radiation due to the exposure of water to direct sunlight, . The soil layer beneath the water is anaerobic, but the roots of the plants produce oxygen, allowing complex biological and chemical interactions to take place.

A wide range of soil types, including bay mud and various silty clays, can support surface flow wetlands.Plants like Water Hyacinth (Eichhornia crassipes) and Pontederia spp. are employed.

Constructed Wetlands
  • Surface flow constructed wetlands, on the other hand, may increase mosquito breeding.
  • They also produce a lot of algae, which degrades the effluent quality.
  • In comparison to subsurface flow built wetlands, they require a larger area to cleanse water.
  • They have a stronger odour and lesser performance in the winter.

Floating treatment wetlands

The floating treatment wetlands (FTWs) are artificial wetlands that replicate natural ones. Floating rafts support hydroponically grown plants in FTWs. The rafts float on the surface of a wet pond and they improve water quality by filtering, consuming, or breaking down contaminants (such as nutrients, silt, and metals) in the water.

Shall we wrap up?

Conclusion

Due to the self-sustaining nature of the constructed wetlands they have a significantly lower lifetime costs compared to the conventional treatment systems. Hence they provide an economical and nature-friendly option for wastewater treatment.

So, how was the trip? Let us know in the comments.

Chemical Oxygen Demand and Total Organic Carbon Analysis

Chemical Oxygen Demand (COD) and Total Organic Carbon (TOC) are widely used analysis methods in water treatment plants, petrochemicals and drinking water treatment. In this blog, let me walk you through the analysis of Chemical Oxygen Demand, Total Organic Carbon and its applications.

Let’s get started with Chemical Oxygen Demand.

  1. What is Chemical Oxygen Demand?
  2. Why COD and TOC are important
  3. Significance of COD/TOC Ratio
  4. Chemical Oxygen Demand Determination
    1. Procedure for Chemical Oxygen Demand
    2. Chemical Oxygen Demand Testing Advantages
    3. Chemical Oxygen Demand Testing Limitations
  5. Total Organic Carbon (TOC)
  6. What does TOC Analyse?
    1. Oxidation Methods
    2. TOC Applications

What is Chemical Oxygen Demand?

Chemical Oxygen Demand is the amount of oxygen required to oxidise all the biodegradable and non-biodegradable organic matter. It evaluates all chemically oxidizable components present in a given wastewater sample. It can be directly linked to the effluent’s actual oxygen requirement on releasing into the environment. Total Organic Carbon testing, in addition to Chemical Oxygen Demand, provides us with a better understanding of a waste stream’s true organic load.

Why COD and TOC are important

COD (Chemical Oxygen Demand) and TOC (Total Organic Carbon) analysis play a vital role in keeping our waterways safe and healthy. By measuring the levels of organic pollution in water and wastewater, these tests help us monitor water quality, evaluate the efficiency of treatment processes, and ensure that we’re meeting environmental regulations. Ultimately, they safeguard our well-being and the delicate balance of aquatic ecosystems.

Significance of COD/TOC Ratio

  • The COD/TOC ratio is a useful tool for assessing the biotreatability of wastewater treatment.
  • At a given point in the wastewater treatment process, the ratio of COD to TOC provides insight into the nature of organic wastewater constituents present.
  • A high COD/TOC ratio indicates easily oxidisable organic molecules like alcohols.
  • Ratios in the range of 0.8 or higher indicate wastes with a high biochemical treatment potential.
  • Lower ratios indicate that the wastes are not amenable to biochemical treatment.
  • The amount of oxygen required as measured by the COD value may change during wastewater treatment, but the carbon concentration as measured by the TOC value does not.
  • As the COD/TOC ratio of wastewater decreases during treatment, it means that the organic compounds are undergoing oxidation and the treatment plant is functioning smoothly.

Also read : Wastewater Treatment- Stages and Process full details

Chemical Oxygen Demand Determination

The COD determination is similar to the BOD determination in the fact that both methods use titration. The basic principle of the COD test is that a strong oxidizing agent can fully oxidize almost all organic compounds to carbon dioxide under acidic conditions.

The best choice would be potassium dichromate which is a strong oxidizing agent under acidic conditions. The addition of sulfuric acid creates acidic conditions for titration. Usually, we use a 0.25 N solution of potassium dichromate for COD determination. However, for samples of COD below 50 mg/L, we use a lower concentration of potassium dichromate.

During the oxidation of the organic substances found in the water sample, potassium dichromate undergoes reduction and forms Cr3+. After the completion of the oxidation reaction, the amount of Cr3+ gives an indirect measure of the organic contents in the water sample.

Procedure for Chemical Oxygen Demand

  • Pipette out 50 ml of the wastewater sample into a flat bottom Erlenmeyer flask.
  • Gently add HgSO4 and 5 mL of sulfuric acid. Swirl the flask continuously until all the mercuric sulfate has dissolved.
  • Now, add 25.0 mL of 0.25N potassium dichromate.
  • Carefully add 70 mL of previously prepared sulfuric acid-silver sulfate solution and gently swirl until the solution is thoroughly mixed.
  • Add glass beads to the refluxing mixture to prevent bumping.
  • Heat the mixture under total reflux conditions for 2 hours.
  • Cool down the mixture to room temperature and titrate it with standard ferrous ammonium sulfate along with 10 drops of ferroin indicator.
  • The end-point of titration is a sharp colour change from blue-green to reddish-brown.
  • Run a blank, with 50 mL of distilled water in place of the sample along with all reagents and subsequent treatment.

COD in mg/l = [(A-B)*M*8000]/sample volume in ml

A = Volume (ml) of Ferrous Ammonium Sulphate used for blank.

B = Volume (ml) of Ferrous Ammonium Sulphate used for sample

M = Molarity of Ferrous Ammponium Sulphate

8000 = milliequivalent weight of oxygen * 1000 ml/L

The COD test doesn’t differentiate between biodegradable and non-biodegradable organic materials. It gives a measure of total oxidisable organic materials in the sample. Therefore, we get higher values of COD than BOD for the same sample. Dichromate oxidises the chlorides and nitrites present in the sample. They create an inorganic COD and generates error in the COD determination.

Chemical Oxygen Demand Analysis

Chemical Oxygen Demand Testing Advantages

  • COD is ideal for checking treatment plant performance and water quality regularly.
  • In comparison to the 5-day BOD test, COD testing is more accurate and has a shorter analysis period (2-hour digesting time).
  • Toxic elements in the sample do not affect the COD oxidant.
  • Changes in COD between influent and effluent may be correlated with BOD content and can be used to augment BOD data.

Chemical Oxygen Demand Testing Limitations

  • The COD technique does not completely oxidise some organic molecules.
  • Chloride ions might cause interference in COD measurements.

Now you got a clear idea about COD determination. Let’s move on to Total Organic Carbon Analysis.

Total Organic Carbon (TOC)

Total Organic Carbon refers to the total amount of organic carbon (including elemental carbon) bound to dissolved or suspended organic substances in water. It is a non-specific indicator of water quality or cleanliness of pharmaceutical manufacturing equipment.

What does TOC Analyse?

The basic principle behind the Total Organic Carbon test is the oxidation of the carbon in the organic matter to carbon dioxide. After that, a non-dispersive infrared analyzer measures the amount of CO2. The amount of CO2 evolved gives a measure of the carbon content in the sample. Further stoichiometric calculations based on the method employed gives the amount of TOC.

TOC analysis measures the following:

  • Total carbon (TC)
  • Inorganic carbon (IC)
  • Total organic carbon (TOC)
  • Purgeable organic carbon (POC)
  • Nonpurgeable organic carbon (NPOC)

TOC analysis measures Total Carbon and Inorganic Carbon. Then we subtract the Inorganic Carbon (IC) from Total Carbon (TC) to find the Total Organic Carbon. This is the TC-IC method.

TOC Analysis
TOC Analysis

According to the TC-TIC method, TOC = TC -T IC

TIC-NPOC method employs acidification of the sample to evolve carbon dioxide. It gives the measure of inorganic carbon (IC) and then oxidation of sample and measurement of the remaining non-purgeable organic carbon (NPOC).

Oxidation Methods

We have a variety of oxidation and detection methods to find out the TOC. Let me show a few of them:

  • High-temperature combustion at 1,200 °C in an oxygen-rich atmosphere. The CO2 passes through scrubber tubes to remove interferences. After that, non-dispersive infrared absorption (NDIR) gives the amount of CO2.
  • High-temperature catalytic oxidation at 680 °C in an oxygen-rich environment inside tubes filled with a platinum catalyst and then NDIR.
  • Thermochemical oxidation in the presence of heat and a chemical oxidizer, usually a persulphate.
  • Photochemical oxidation in the presence of UV and a chemical oxidizer like persulphate.
  • Photo-oxidation by ultra-violet (UV) light alone or with a catalyst. In a UV-irradiated chamber, combine sample with persulfate to convert organics to carbon dioxide. The UV oxidation method offers the most reliable, low maintenance method of determining TOC in ultra-pure waters.

Accurate detection and quantification are very crucial to get accurate results in TOC analysis. The most commonly used methods include conductivity and non-dispersive infrared (NDIR).

TOC Applications

  • In oil exploration, the initial chemical study on a prospective petroleum source rock is TOC.
  • TOC helps in detecting pollutants in drinking water, cooling water, semiconductor production water, and pharmaceutical-grade water.
  • It finds applications in controlling the release of organic chemicals into the environment at a production facility.
  • Furthermore, a low TOC can demonstrate the absence of potentially dangerous organic compounds in pharmaceutical manufacturing water.
  • Because of the byproducts, TOC is also of importance in the field of drinking water treatment.

That’s it about the analysis of Chemical Oxygen Demand and Total Organic Carbon. Hope you found it informative. Let us know your queries in the comments section.

Gritt chamber – Types and Uses

Grit Chambers are one of the most commonly used types of equipment in the wastewater treatment process. In this blog, I will walk you through the mechanism, types and uses of grit chambers. Before diving deep into grit chambers, make sure that you go through these blogs so that you know what exactly happens in a wastewater treatment plant.

  1. What are Grit Chambers?
  2. Grit Chambers Working Principle
  3. Grit Chamber Types
    1. Mechanically cleaned
    2. Manually Cleaned
    3. Horizontal Flow Grit Chambers
    4. Aerated Grit Chambers
    5. Vortex Type Grit Chambers
  4. Grit Chamber Uses  
  5. Conclusion

What are Grit Chambers?

Grit chambers are settling tanks or basins that collect the inorganic particles and avoid their accumulation in sludge digesters as well as prevent damage to the pumps. Grit will damage pumps by abrasion and cause serious operational difficulties in sedimentation tanks and sludge digesters as it can accumulate around outlets and pump suction thereby choking them. Consequently, it is common practice to remove this material by grit chambers.

We usually place them ahead of pumps or comminuting devices. Mechanically cleaned grit chambers should be preceded by coarse bar rack screens. We typically design the Grit chambers as a long channel in which we reduce, the wastewater’s velocity sufficiently to deposit heavy inorganic solids but to retain organic material in suspension. Channel-type chambers should provide controlled velocities as close as possible to 1.0 feet per second. Velocities substantially more significant than 1.0 feet per second cause excessive organic materials to settle out with the grit. The detention period is usually between 20 seconds to 1.0 minutes.

Grit Chambers Working Principle

The critical velocity of flow should always be lesser than the critical scouring velocity so that the inorganic particles settle.

Grit Chamber Types

We can classify grit chambers into two types, depending on the cleaning mechanism.

Mechanically cleaned

A mechanically cleaned grit chamber uses mechanical means to remove the accumulated grit. Scraper blades in a mechanically cleaned grit chamber collect the grit that has accumulated on the chamber’s floor. By using various devices such as bucket elevators, jet pumps, and airlifts, we can raise this grit to ground level and remove them. The grit washing mechanisms mostly include agitation tools that use either water or air to provide washing action.

Manually Cleaned

In the manually cleaned Grit chamber, we remove the grit manually using a shovel. We must clean them at least once each week. Also, they should have adequate capacity for storing grits between the time of cleaning.

Based on the mode of operation, we can classify grit chambers as follows:

Horizontal Flow Grit Chambers

These are long narrow tanks about 10-18 meters long and 1 to 1.3 m in depth and rely on gravity to settle out the heavy solids. The wastewater is directed into the tank at a controlled rate and the velocity is kept low to allow the particles to settle to the bottom of the tank. We remove the settled material with a scraper mechanism or airlift pump.

Horizontal Flow Grit Chambers

Aerated Grit Chambers

Aerated grit chambers use a combination of mechanical mixing and agitation with air to prevent the solids from settling and keep them in suspension. After mixing with air, the mixture flows into a settling zone to separate the solids. The diffusers are located at about 0.45 to 0.6 m from the bottom. Wastewater moves in the tank in a helical path and makes two or three passes across the bottom of the tank at maximum flow. Wastewater is introduced in the direction of roll in the grit chamber. This type of grit chamber has grit removal grab buckets, travelling on monorails over the grit collection and storage trough. We can also use chain and bucket conveyors.

 Typical design details for the aerated grit chamber are : 

  • Depth: 2 to 5 m 
  • Length: 7.5 to 20 m 
  • Width: 2.5 to 7.0 m 
  • Width to depth ratio: 1:1 to 5:1 
  • Air supply m3 /m.min of length: 0.15 to 0.45 (0.3 typical)
  • Detention time at peak flow: 2 to 5 min (3 minutes typical) 

Vortex Type Grit Chambers

 In this grit is removed with a vortex flow pattern. The wastewater enters tangentially and exits in the perpendicular direction of motion either from the top or from the side. Due to inertia, the grit particle will remain in the chamber and liquid free from grit will only escape. The rotating turbine maintains constant velocity and helps in separating organic matter and grit. We get washed grit, free from the organic matter from this device.

Now, let’s have a look at the uses of grit chambers.

Grit Chamber Uses  

The uses of the grit chamber are as follows:

  • Prevents equipment from clogging.
  • Slow down the flow to settle heavy solids.
  • Saves the wastewater treatment cost.
  • Controls grit collection in sludge digesters.
Grit Chamber

Conclusion

In this blog, we saw the working principle, types and uses of grit chambers. If you have any queries please feel free to ask in the comments section.