Category Archives: Water pollution

Eutrophication – Definition, Causes, Effects and Control

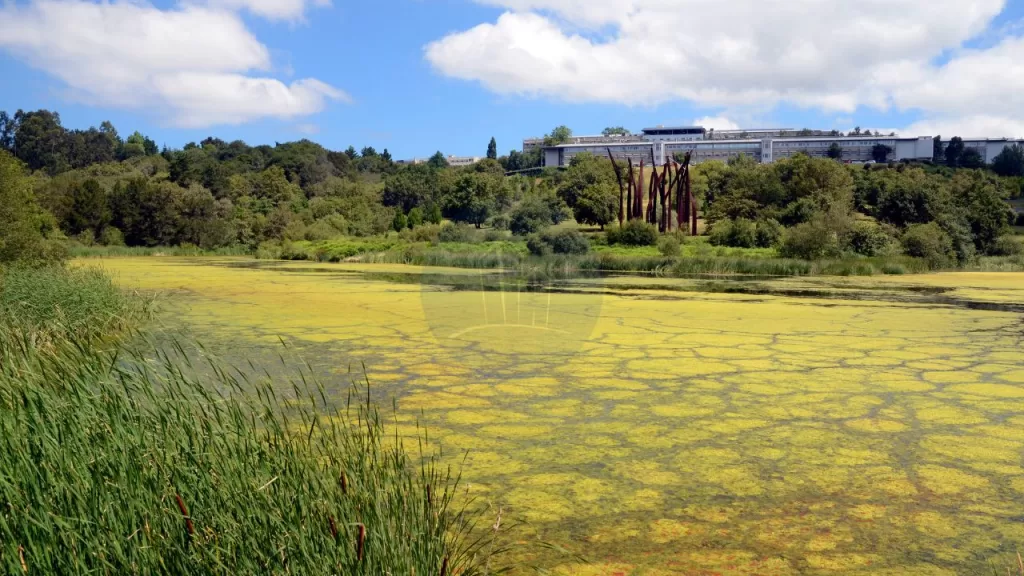
Eutrophication is a natural process in water bodies that becomes problematic when accelerated by human activities. It is caused by the excessive accumulation of nutrients, particularly nitrogen and phosphorus, leading to algal blooms and oxygen depletion. This phenomenon, also known as cultural eutrophication, occurs when agricultural runoff, wastewater discharge, and industrial effluents introduce pollutants into water systems. The cause of eutrophication is primarily linked to nutrient overloading, which fosters the growth of algae, eventually causing harm to aquatic ecosystems. The process of eutrophication disrupts aquatic life, while its effects include loss of biodiversity, poor water quality, and fish mortality. Understanding eutrophication causes and effects is crucial for managing its impact. In simple terms, eutrophication explained involves the imbalance caused by excess nutrients in aquatic systems.

Eutrophication in US freshwaters costs approximately $2.2 billion per year. Astonishing, right? Want to know more about this process that can wreak havoc if left unchecked? In this blog, let’s visit a eutrophied lake and understand the entire events that lead to eutrophication and its effects.

Let’s dive in.

  1. What Is Eutrophication?
  2. Eutrophication Process
  3. Types of Eutrophication
    1. Natural Eutrophication
    2. Cultural Eutrophication
  4. Eutrophication Effects
    1. Loss of Biodiversity
    2. Harmful Algal Blooms (HABs)
    3. Monetary Loss
  5. Eutrophication Control Measures
  6. Key Takeaways
  7. Conclusion

What Is Eutrophication?

Eutrophication refers to the process of nutrient over-enrichment in water bodies. It involves primarily nitrogen and phosphorus. This leads to excessive algal and plankton growth. This phenomenon, often termed cultural eutrophication, occurs due to human activities such as agricultural runoff and fertilizer use. Eutrophication explained highlights that this process reduces dissolved oxygen levels, causing poor water quality and threatening aquatic ecosystems.

The cause of eutrophication is primarily linked to artificial fertilizers and untreated waste discharge. As algae bloom, oxygen depletion follows, creating “dead zones” incapable of supporting life. This causes both environmental and ecological harm, ranking alongside global warming and deforestation. Understanding eutrophication meaning involves addressing the causes of eutrophication like synthetic fertilizers and urban runoff. The effects of eutrophication include biodiversity loss and water quality degradation, making it a critical issue in environmental management.

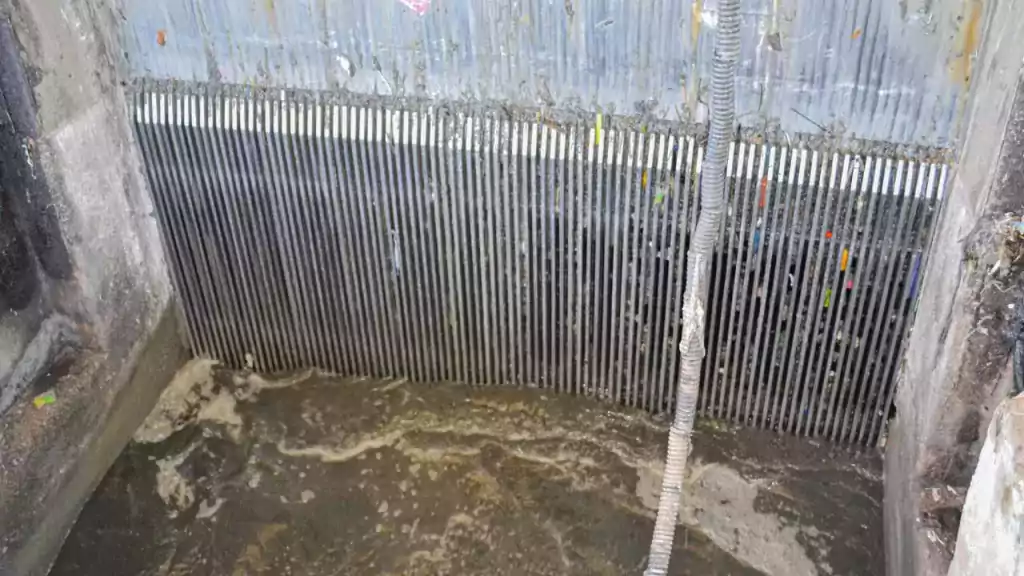
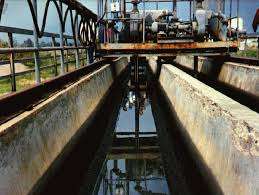
Also check out : Wastewater Treatment- Stages and Process full details.

In the next section, I will show you how a water body undergoes eutrophication.

Eutrophication Process

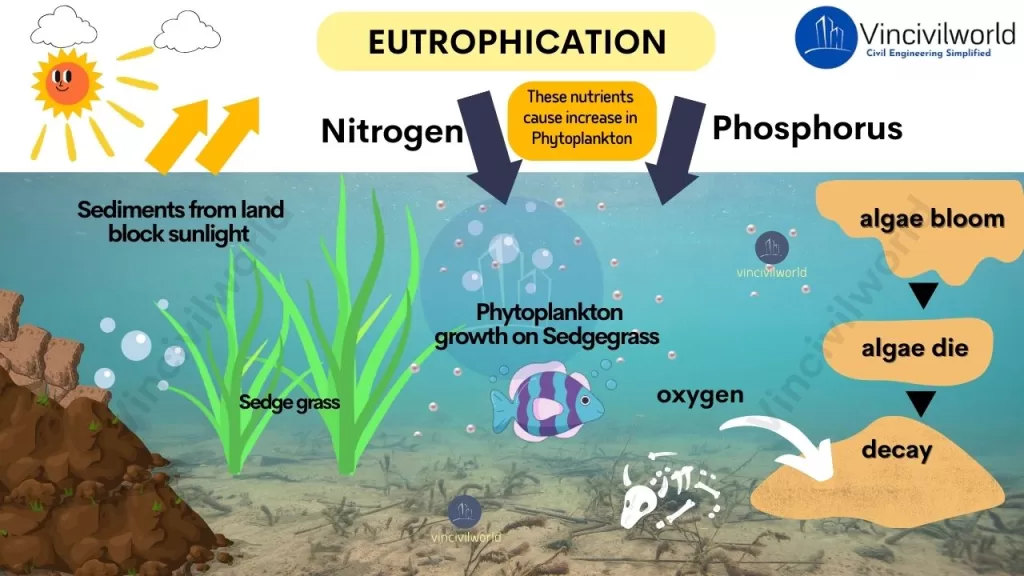
  • Soil receives nutrients in excess from synthetic fertilizers. Surface runoff washes them away into the water body.
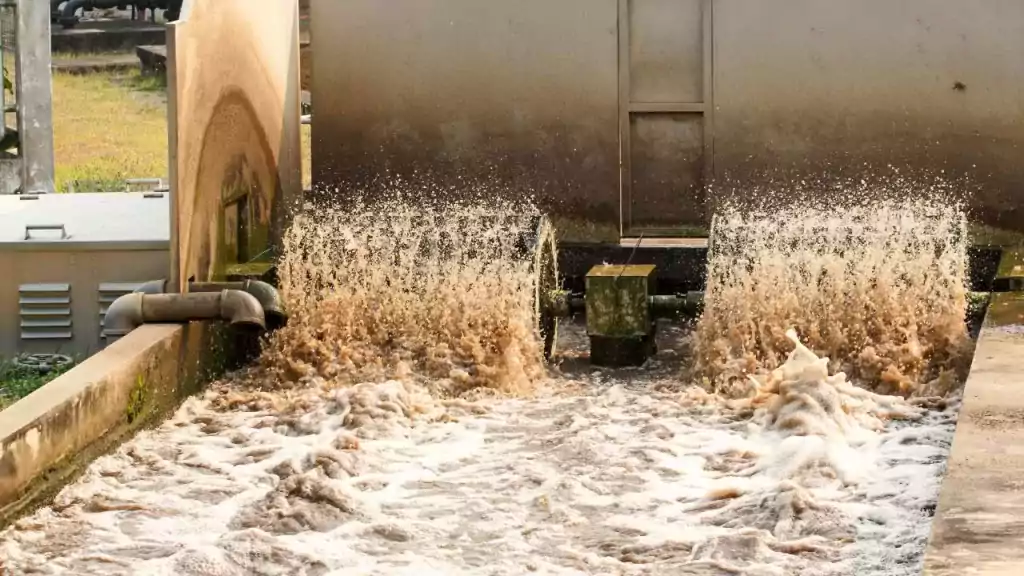
  • Nutrients reach the water body via untreated sewage and industrial effluents too.
  • Excess nutrients cause accelerated growth of algae or algal bloom.
  • Light penetration reduces due to the algal bloom.
  • Plants beneath the algal bloom perish because they are unable to perform photosynthesis in the absence of sunshine.
  • The algal bloom eventually dies and settles to the lake’s bottom.
  • Bacterial populations begin to break down the remnants, consuming oxygen in the process.
  • Oxygen is lost in the water as a result of decomposition.
  • Aquatic organisms die due to a lack of dissolved oxygen. The waterbody turns into a dead zone which doesn’t support life.
Eutrophication Process

Types of Eutrophication

Based on the source of nutrient enrichment, there are two types of eutrophication. They are:

Natural Eutrophication

Although human activities are the most prevalent cause of eutrophication, it can also be a natural process, especially in lakes. Due to climate change, geology and other external factors, the nutrient density of a water body increases over time and undergoes the process of natural eutrophication.

A few lakes also show the reverse process called meiotrophication. In this process, nutrient-poor inputs make the lake less nutrient-rich over time. Artificial lakes and reservoirs usually undergo this process, which starts out as very eutrophic but eventually become oligotrophic. An oligotrophic lake is a lake with low primary productivity due to low nutrient content.

The major difference between natural and anthropogenic eutrophication lies in the timescale. The former takes geologic ages to complete while the latter is a quick process.

Cultural Eutrophication

Eutrophication caused by human activity is also known as cultural or anthropogenic eutrophication. It is a process that accelerates natural eutrophication. Land runoff increases as a result of the land clearing and construction of towns and cities. Therefore, surface runoff from croplands carry nutrients such as phosphates and nitrate into the lakes and rivers, and then to coastal estuaries and bays.

When excess nutrients from anthropogenic sources such as runoff from fertilised croplands, lawns, and golf courses, untreated sewage and wastewater end up in water bodies, they cause nutrient pollution and simultaneously speeds up the natural process of eutrophication. The degradation of water quality induced by cultural eutrophication severely impacts human uses such as potable water, industrial usage, and recreation.

Let’s move on to the section describing its effects or consequences.

Eutrophication Effects

The effects of eutrophication range from ecological losses to economical losses. Let’s have a closer look at each one of them.

Loss of Biodiversity

Aquatic environments support a diverse range of plant and animal life. The process of eutrophication disrupts the ecosystem’s balance by promoting the growth of basic plant life. The ecosystem’s biodiversity is drastically reduced as a result of the loss of some desirable species.

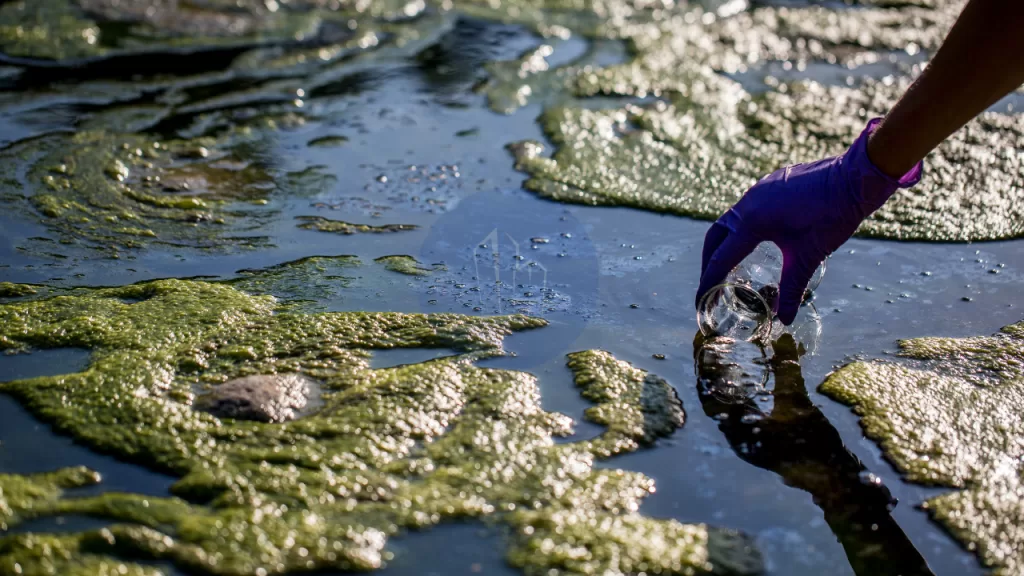
The most noticeable consequence of cultural eutrophication is the formation of dense blooms of toxic, foul-smelling blue-green algae or cyanobacteria that impairs water clarity and quality. Algal blooms reduce light penetration. This limits aquatic plant growth and diminishes the success of predators that rely on light to hunt and catch prey in the benthic zone. Eventually, it leads to the mass death of aquatic plants and organisms.

Furthermore, eutrophication’s high rates of photosynthesis drain dissolved inorganic carbon and elevate pH to dangerously high levels throughout the day. By diminishing chemosensory skills, elevated pH can ‘blind’ organisms that use the sense of dissolved chemical cues for survival.

When the dense algal blooms die, microbial breakdown depletes dissolved oxygen, resulting in a hypoxic or anoxic “dead zone” where most species are unable to survive. Many freshwater lakes contain dead zones. Eutrophication-induced hypoxia (extremely low oxygen concentrations in bottom waters) and anoxia pose a danger to profitable commercial and recreational fisheries around the world.

Eutrophication effects

Harmful Algal Blooms (HABs)

Some algal blooms are also dangerous because they produce toxins like microcystin and anatoxin-a. Harmful algal blooms (HABs) leads to:

  • water quality degradation
  • the extinction of commercially important fishes 
  • public health problems 

Toxic cyanobacteria such as Anabaena, Cylindrospermopsis, Microcystis, and Oscillatoria (Planktothrix) dominate nutrient-rich, freshwater systems due to their superior competitive abilities under high nutrient concentrations, low nitrogen-to-phosphorus ratios, low light levels, reduced mixing, and high temperatures.

Algal Blooms
Algal Blooms

Toxic cyanobacteria bloom causes poisonings of domestic animals, wildlife, and even humans all around the world. For instance, shellfish poisoning is a result of HABs. Shellfish ingests the biotoxins produced during algal blooms. When humans consume them, it leads to various kinds of poisoning including paralytic, neurotoxic, and diarrhoetic shellfish poisoning.

Ciguatera, a predator fish becomes a vector for such toxins by accumulating the poison in its body and then poisoning the humans who consume it. Furthermore, cyanobacteria are responsible for various off-flavour compounds (such as methyl isoborneol and geosmin) detected in municipal drinking water systems.

Monetary Loss

Due to the continuous feeding of the fish, aquaculture ponds often accumulate high concentrations of nutrients such as nitrogen and phosphorus. As a result, these ponds are subjected to cyanobacterial blooms and hypoxia regularly. aquaculture-reared fish, resulting in significant financial losses.

Eutrophication also lowers the recreational value of rivers, lakes, and beaches. This severely impacts the tourism sector. When eutrophic conditions interfere with the treatment of drinking water, health concerns and monetary losses arise.

OK, I know what you’re thinking. How to control eutrophication, right? Read on to find more.

Eutrophication Control Measures

  • Prevent the flow of plant nutrients to water bodies. Reduce the overuse of synthetic fertilizers.
  • Proper channelling of agricultural wastes and runoffs.
  • Releasing only safe and treated effluents to water bodies.
  • Seaweed cultivation absorbs nitrogen and phosphorous and removes excess nutrients.
  • Promoting the growth of shellfish.

That’s it about eutrophication. Hope you found it useful.

Key Takeaways

Eutrophication is a nutrient enrichment process in water bodies, primarily caused by nitrogen and phosphorus. While natural eutrophication takes centuries, cultural eutrophication accelerates due to human activities like agricultural runoff and untreated wastewater. This leads to algal blooms, oxygen depletion, and the formation of hypoxic or “dead zones,” harming aquatic ecosystems. Key effects include biodiversity loss, harmful algal blooms (HABs), water quality degradation, and economic losses in fisheries and recreation. Addressing eutrophication requires reducing nutrient pollution from fertilizers and industrial effluents. Understanding this process and its impacts is crucial for effective environmental management.

Conclusion

Eutrophication, whether natural or cultural, poses significant ecological and economic challenges. Cultural eutrophication, driven by human activities, intensifies nutrient pollution, causing harmful algal blooms and oxygen-depleted waters. The resulting biodiversity loss and water quality degradation lead to habitat destruction and economic losses, such as reduced fisheries and recreational opportunities. Combating eutrophication demands action, including limiting nutrient runoff, improving wastewater treatment, and promoting sustainable agricultural practices. By addressing these causes, we can mitigate the adverse effects on aquatic ecosystems and preserve water resources. Understanding eutrophication is key to safeguarding our environment and ensuring long-term ecological balance.

Chemical Oxygen Demand and Total Organic Carbon Analysis

Chemical Oxygen Demand (COD) and Total Organic Carbon (TOC) are widely used analysis methods in water treatment plants, petrochemicals and drinking water treatment. In this blog, let me walk you through the analysis of Chemical Oxygen Demand, Total Organic Carbon and its applications.

Let’s get started with Chemical Oxygen Demand.

  1. What is Chemical Oxygen Demand?
  2. Why COD and TOC are important
  3. Significance of COD/TOC Ratio
  4. Chemical Oxygen Demand Determination
    1. Procedure for Chemical Oxygen Demand
    2. Chemical Oxygen Demand Testing Advantages
    3. Chemical Oxygen Demand Testing Limitations
  5. Total Organic Carbon (TOC)
  6. What does TOC Analyse?
    1. Oxidation Methods
    2. TOC Applications

What is Chemical Oxygen Demand?

Chemical Oxygen Demand is the amount of oxygen required to oxidise all the biodegradable and non-biodegradable organic matter. It evaluates all chemically oxidizable components present in a given wastewater sample. It can be directly linked to the effluent’s actual oxygen requirement on releasing into the environment. Total Organic Carbon testing, in addition to Chemical Oxygen Demand, provides us with a better understanding of a waste stream’s true organic load.

Why COD and TOC are important

COD (Chemical Oxygen Demand) and TOC (Total Organic Carbon) analysis play a vital role in keeping our waterways safe and healthy. By measuring the levels of organic pollution in water and wastewater, these tests help us monitor water quality, evaluate the efficiency of treatment processes, and ensure that we’re meeting environmental regulations. Ultimately, they safeguard our well-being and the delicate balance of aquatic ecosystems.

Significance of COD/TOC Ratio

  • The COD/TOC ratio is a useful tool for assessing the biotreatability of wastewater treatment.
  • At a given point in the wastewater treatment process, the ratio of COD to TOC provides insight into the nature of organic wastewater constituents present.
  • A high COD/TOC ratio indicates easily oxidisable organic molecules like alcohols.
  • Ratios in the range of 0.8 or higher indicate wastes with a high biochemical treatment potential.
  • Lower ratios indicate that the wastes are not amenable to biochemical treatment.
  • The amount of oxygen required as measured by the COD value may change during wastewater treatment, but the carbon concentration as measured by the TOC value does not.
  • As the COD/TOC ratio of wastewater decreases during treatment, it means that the organic compounds are undergoing oxidation and the treatment plant is functioning smoothly.

Also read : Wastewater Treatment- Stages and Process full details

Chemical Oxygen Demand Determination

The COD determination is similar to the BOD determination in the fact that both methods use titration. The basic principle of the COD test is that a strong oxidizing agent can fully oxidize almost all organic compounds to carbon dioxide under acidic conditions.

The best choice would be potassium dichromate which is a strong oxidizing agent under acidic conditions. The addition of sulfuric acid creates acidic conditions for titration. Usually, we use a 0.25 N solution of potassium dichromate for COD determination. However, for samples of COD below 50 mg/L, we use a lower concentration of potassium dichromate.

During the oxidation of the organic substances found in the water sample, potassium dichromate undergoes reduction and forms Cr3+. After the completion of the oxidation reaction, the amount of Cr3+ gives an indirect measure of the organic contents in the water sample.

Procedure for Chemical Oxygen Demand

  • Pipette out 50 ml of the wastewater sample into a flat bottom Erlenmeyer flask.
  • Gently add HgSO4 and 5 mL of sulfuric acid. Swirl the flask continuously until all the mercuric sulfate has dissolved.
  • Now, add 25.0 mL of 0.25N potassium dichromate.
  • Carefully add 70 mL of previously prepared sulfuric acid-silver sulfate solution and gently swirl until the solution is thoroughly mixed.
  • Add glass beads to the refluxing mixture to prevent bumping.
  • Heat the mixture under total reflux conditions for 2 hours.
  • Cool down the mixture to room temperature and titrate it with standard ferrous ammonium sulfate along with 10 drops of ferroin indicator.
  • The end-point of titration is a sharp colour change from blue-green to reddish-brown.
  • Run a blank, with 50 mL of distilled water in place of the sample along with all reagents and subsequent treatment.

COD in mg/l = [(A-B)*M*8000]/sample volume in ml

A = Volume (ml) of Ferrous Ammonium Sulphate used for blank.

B = Volume (ml) of Ferrous Ammonium Sulphate used for sample

M = Molarity of Ferrous Ammponium Sulphate

8000 = milliequivalent weight of oxygen * 1000 ml/L

The COD test doesn’t differentiate between biodegradable and non-biodegradable organic materials. It gives a measure of total oxidisable organic materials in the sample. Therefore, we get higher values of COD than BOD for the same sample. Dichromate oxidises the chlorides and nitrites present in the sample. They create an inorganic COD and generates error in the COD determination.

Chemical Oxygen Demand Analysis

Chemical Oxygen Demand Testing Advantages

  • COD is ideal for checking treatment plant performance and water quality regularly.
  • In comparison to the 5-day BOD test, COD testing is more accurate and has a shorter analysis period (2-hour digesting time).
  • Toxic elements in the sample do not affect the COD oxidant.
  • Changes in COD between influent and effluent may be correlated with BOD content and can be used to augment BOD data.

Chemical Oxygen Demand Testing Limitations

  • The COD technique does not completely oxidise some organic molecules.
  • Chloride ions might cause interference in COD measurements.

Now you got a clear idea about COD determination. Let’s move on to Total Organic Carbon Analysis.

Total Organic Carbon (TOC)

Total Organic Carbon refers to the total amount of organic carbon (including elemental carbon) bound to dissolved or suspended organic substances in water. It is a non-specific indicator of water quality or cleanliness of pharmaceutical manufacturing equipment.

What does TOC Analyse?

The basic principle behind the Total Organic Carbon test is the oxidation of the carbon in the organic matter to carbon dioxide. After that, a non-dispersive infrared analyzer measures the amount of CO2. The amount of CO2 evolved gives a measure of the carbon content in the sample. Further stoichiometric calculations based on the method employed gives the amount of TOC.

TOC analysis measures the following:

  • Total carbon (TC)
  • Inorganic carbon (IC)
  • Total organic carbon (TOC)
  • Purgeable organic carbon (POC)
  • Nonpurgeable organic carbon (NPOC)

TOC analysis measures Total Carbon and Inorganic Carbon. Then we subtract the Inorganic Carbon (IC) from Total Carbon (TC) to find the Total Organic Carbon. This is the TC-IC method.

TOC Analysis
TOC Analysis

According to the TC-TIC method, TOC = TC -T IC

TIC-NPOC method employs acidification of the sample to evolve carbon dioxide. It gives the measure of inorganic carbon (IC) and then oxidation of sample and measurement of the remaining non-purgeable organic carbon (NPOC).

Oxidation Methods

We have a variety of oxidation and detection methods to find out the TOC. Let me show a few of them:

  • High-temperature combustion at 1,200 °C in an oxygen-rich atmosphere. The CO2 passes through scrubber tubes to remove interferences. After that, non-dispersive infrared absorption (NDIR) gives the amount of CO2.
  • High-temperature catalytic oxidation at 680 °C in an oxygen-rich environment inside tubes filled with a platinum catalyst and then NDIR.
  • Thermochemical oxidation in the presence of heat and a chemical oxidizer, usually a persulphate.
  • Photochemical oxidation in the presence of UV and a chemical oxidizer like persulphate.
  • Photo-oxidation by ultra-violet (UV) light alone or with a catalyst. In a UV-irradiated chamber, combine sample with persulfate to convert organics to carbon dioxide. The UV oxidation method offers the most reliable, low maintenance method of determining TOC in ultra-pure waters.

Accurate detection and quantification are very crucial to get accurate results in TOC analysis. The most commonly used methods include conductivity and non-dispersive infrared (NDIR).

TOC Applications

  • In oil exploration, the initial chemical study on a prospective petroleum source rock is TOC.
  • TOC helps in detecting pollutants in drinking water, cooling water, semiconductor production water, and pharmaceutical-grade water.
  • It finds applications in controlling the release of organic chemicals into the environment at a production facility.
  • Furthermore, a low TOC can demonstrate the absence of potentially dangerous organic compounds in pharmaceutical manufacturing water.
  • Because of the byproducts, TOC is also of importance in the field of drinking water treatment.

That’s it about the analysis of Chemical Oxygen Demand and Total Organic Carbon. Hope you found it informative. Let us know your queries in the comments section.

Gritt chamber – Types and Uses

Grit Chambers are one of the most commonly used types of equipment in the wastewater treatment process. In this blog, I will walk you through the mechanism, types and uses of grit chambers. Before diving deep into grit chambers, make sure that you go through these blogs so that you know what exactly happens in a wastewater treatment plant.

  1. What are Grit Chambers?
  2. Grit Chambers Working Principle
  3. Grit Chamber Types
    1. Mechanically cleaned
    2. Manually Cleaned
    3. Horizontal Flow Grit Chambers
    4. Aerated Grit Chambers
    5. Vortex Type Grit Chambers
  4. Grit Chamber Uses  
  5. Conclusion

What are Grit Chambers?

Grit chambers are settling tanks or basins that collect the inorganic particles and avoid their accumulation in sludge digesters as well as prevent damage to the pumps. Grit will damage pumps by abrasion and cause serious operational difficulties in sedimentation tanks and sludge digesters as it can accumulate around outlets and pump suction thereby choking them. Consequently, it is common practice to remove this material by grit chambers.

We usually place them ahead of pumps or comminuting devices. Mechanically cleaned grit chambers should be preceded by coarse bar rack screens. We typically design the Grit chambers as a long channel in which we reduce, the wastewater’s velocity sufficiently to deposit heavy inorganic solids but to retain organic material in suspension. Channel-type chambers should provide controlled velocities as close as possible to 1.0 feet per second. Velocities substantially more significant than 1.0 feet per second cause excessive organic materials to settle out with the grit. The detention period is usually between 20 seconds to 1.0 minutes.

Grit Chambers Working Principle

The critical velocity of flow should always be lesser than the critical scouring velocity so that the inorganic particles settle.

Grit Chamber Types

We can classify grit chambers into two types, depending on the cleaning mechanism.

Mechanically cleaned

A mechanically cleaned grit chamber uses mechanical means to remove the accumulated grit. Scraper blades in a mechanically cleaned grit chamber collect the grit that has accumulated on the chamber’s floor. By using various devices such as bucket elevators, jet pumps, and airlifts, we can raise this grit to ground level and remove them. The grit washing mechanisms mostly include agitation tools that use either water or air to provide washing action.

Manually Cleaned

In the manually cleaned Grit chamber, we remove the grit manually using a shovel. We must clean them at least once each week. Also, they should have adequate capacity for storing grits between the time of cleaning.

Based on the mode of operation, we can classify grit chambers as follows:

Horizontal Flow Grit Chambers

These are long narrow tanks about 10-18 meters long and 1 to 1.3 m in depth and rely on gravity to settle out the heavy solids. The wastewater is directed into the tank at a controlled rate and the velocity is kept low to allow the particles to settle to the bottom of the tank. We remove the settled material with a scraper mechanism or airlift pump.

Horizontal Flow Grit Chambers

Aerated Grit Chambers

Aerated grit chambers use a combination of mechanical mixing and agitation with air to prevent the solids from settling and keep them in suspension. After mixing with air, the mixture flows into a settling zone to separate the solids. The diffusers are located at about 0.45 to 0.6 m from the bottom. Wastewater moves in the tank in a helical path and makes two or three passes across the bottom of the tank at maximum flow. Wastewater is introduced in the direction of roll in the grit chamber. This type of grit chamber has grit removal grab buckets, travelling on monorails over the grit collection and storage trough. We can also use chain and bucket conveyors.

 Typical design details for the aerated grit chamber are : 

  • Depth: 2 to 5 m 
  • Length: 7.5 to 20 m 
  • Width: 2.5 to 7.0 m 
  • Width to depth ratio: 1:1 to 5:1 
  • Air supply m3 /m.min of length: 0.15 to 0.45 (0.3 typical)
  • Detention time at peak flow: 2 to 5 min (3 minutes typical) 

Vortex Type Grit Chambers

 In this grit is removed with a vortex flow pattern. The wastewater enters tangentially and exits in the perpendicular direction of motion either from the top or from the side. Due to inertia, the grit particle will remain in the chamber and liquid free from grit will only escape. The rotating turbine maintains constant velocity and helps in separating organic matter and grit. We get washed grit, free from the organic matter from this device.

Now, let’s have a look at the uses of grit chambers.

Grit Chamber Uses  

The uses of the grit chamber are as follows:

  • Prevents equipment from clogging.
  • Slow down the flow to settle heavy solids.
  • Saves the wastewater treatment cost.
  • Controls grit collection in sludge digesters.
Grit Chamber

Conclusion

In this blog, we saw the working principle, types and uses of grit chambers. If you have any queries please feel free to ask in the comments section.

What are Water Pollutants? – Definition, Sources and Types

Water Pollutants kill more people every year than from all forms of violence including war, according to the UNDESA. Every day, 2 million tons of sewage, industrial, and agricultural waste reaches water bodies all over the world. With the growth of the human population, industrial and agricultural activities the hydrological cycle got disrupted. As a result, declining water quality has become a global issue of concern.

In this blog, I will take you on a short trip exploring the various water pollutants, its sources and effects.

Water Pollutants Definition

Water Pollutants are the organic or inorganic chemicals and microbes that degrade the water quality of a water body and renders it hazardous for human consumption and the aquatic life thriving in it. Toxic compounds from farms, cities, and factories easily dissolve and combine with it, polluting the water.

Water, also known as a “universal solvent,” can dissolve more chemicals than any other liquid on the planet. It’s also the reason why water gets easily polluted.

Water pollution
Water pollution

Water Pollutants Sources

The sources of water pollutants belong to two categories.

  • Point Source Water Pollutants
  • Non-Point source Water Pollutants

Point Source Water Pollutants

Point source water pollution occurs when contamination arises from a single source. Examples of point source water pollutants include contamination from leaking septic systems, chemical and oil spills, effluent released illegally by an oil refinery, or wastewater treatment plant . While point source water pollutants originate in a single location, it has the potential to pollute miles of streams and the ocean.

Non-Point Source Water Pollutants

Water Pollutants arising from dispersed sources is referred to as non point source water pollutants. Agricultural or storm water runoff, pond ash from ash dykes, as well as debris blown into streams from land, are examples. Above all, it’s tough to control because there’s no single, recognisable source.

Water Pollutants Types

Water Pollutants are classified into nine types as shown below.

  • Oxygen Demanding Wastes
  • Disease-causing Agents
  • Synthetic Organic Compounds
  • Plant Nutrients
  • Inorganic Chemicals and Minerals
  • Sediments
  • Radioactive Substances
  • Thermal Discharges
  • Oil

Oxygen Demanding Wastes

  • Organic wastes which demand a high amount of dissolved oxygen for their microbial decomposition are referred to as oxygen demanding wastes.
  • Such kind of organic wastes arises from sewage, food processing plants, tanning operations etc.
  • Biochemical Oxygen Demand or BOD measures the water pollution potential of the organic waste.
  • The amount of dissolved oxygen (DO) required by aerobic biological organisms to decompose the organic waste present in a given water sample at a particular temperature over a given time period is known as biochemical oxygen demand (BOD).
  • Oxygen demand is directly proportional to the organic waste concentration in the water.
  • In other words, the higher the BOD of the wastewater, the higher is the amount of oxygen required for the degradation of waste.
  • Oxygen demanding wastes pose a hazard to aquatic life by using up the dissolved oxygen in the water for its degradation.
Water pollution effects on aquatic life

Disease-causing Agents

Sewage and wastes from farms and industries like tanning and meat packaging industries carry pathogens into the water bodies. As a result, water contains bacteria which causes cholera, typhoid, amoebic dysentery and viruses responsible for polio, coxsackie fever. These pathogens enter the human body through drinking water and other activities.

Escherichia coli is a harmless bacteria found in high concentrations in human faeces. They are used to assess the hygienic quality of water. Since the coliforms usually travel together with the pathogens, a high concentration of E. coli indicates faecal contamination and the presence of pathogens.

Synthetic Organic Compounds

  • Pesticides, insecticides and herbicides used in the crop fields reach the water bodies via surface runoff from agricultural lands and stormwater.
  • The commonly used chlorinated pesticides include aldrin, dieldrin and DDT.
  • They are highly stable, volatile and soluble in fats and oils and they accumulate in the bodies of aquatic organisms.
  • Through biological magnification, it gets more concentrated from one trophic level to the next in the food chain.
  • Fishes and predatory birds are the victims of pesticide pollution. For instance, dieldrin affects the calcium metabolism in predatory birds and leads to thinning of their eggshells.
  • Through drinking water and consumption of fishes, pesticide residues enter the human body.
  • The surfactants present in detergents create foam in water bodies and hamper the oxygen absorption of water. And, higher levels of phosphate act as a plant nutrient and generate eutrophic conditions.

Plant Nutrients

  • Phosphates, nitrates and ammonia are the major plant nutrients. They find their way into water bodies via effluents from fertilizer, food and textile industries.
  • As the concentration of these nutrients increases in the water bodies, algae absorbs them and grows excessively, resulting in eutrophication.
  • The process through which a water body gets enriched in dissolved nutrients is known as eutrophication.
  • This leads to algal bloom and develops a green slime layer over the surface of the water.
  • Therefore, sunlight can’t reach the bottom of the water bodies and this hampers atmospheric reoxygenation.
  • After that, the algal growth dies down and its degradation results in anaerobic conditions.
  • An anaerobic bacterium, Clostridium botulinum can flourish in this environment. It secretes a powerful toxin, botulinum that kills the algae feeding birds and humans.
  • Nitrate enters the human body through drinking water. It forms a complex, methaemoglobin which reduces the oxygen-carrying capacity of the blood. This leads to a fatal condition called methaemoglobin anaemia or blue baby disease.

Inorganic Chemicals and Minerals

The water pollutants like inorganic salts, mineral acids, finely divided metals and metal compounds fall under the category of inorganic chemicals and minerals. Municipal and industrial wastewater and mine runoffs are the main sources of these pollutants. Sulphur and coal mining leads to acid mine drainage consisting of sulphuric acid and iron compounds. In addition to this, tanneries, textiles and coke oven operations release alkalies to the water bodies.

  • Cadmium, Chromium, Lead, Mercury and Silver are metals found in industrial wastewater that requires serious attention.
  • Effluents from chemical plants, electroplating and textiles generate cadmium. The use of cadmium contaminated water for irrigation may have been the reason for itai-itai disease in Japan.
  • Wastewaters from aluminium anodizing, paint and dye industries, ceramic and glass industry brings both trivalent and hexavalent chromium to the water bodies.
  • Lead is present in industrial effluents from battery manufacture, printing and painting operations. It is a cumulative poison and concentrates mainly on the bones.
  • The most toxic aquatic pollutant is mercury owing to its rapid methylation in the aquatic environment. It builds up in the food chain and reaches toxic levels at the top of the trophic level.
  • Severe mercury poisoning causes Minamata disease, a neurological disease. Industrial effluents from chlorine and caustic soda, fertilizers and pesticides are the main culprits of mercury pollution.
  • The main sources of silver in wastewater are electroplating and photographic operations.
Water Pollution by chemicals

Sediments

Soil, sand and mineral particles reaching the aquatic environment through floodwaters constitute the sediments. The presence of sediments increases the turbidity of water bodies. Therefore, sunlight can’t penetrate to the bottom and its availability to aquatic plants decreases. Moreover, they cause the thickening of fish gills and asphyxiation of the fish and sediments also destroy the spawning sites of fish on the river bed.

Radioactive Substances

The radioactive material used in industrial, medical, or scientific activities creates nuclear waste. Uranium and thorium mining and refining are also sources of nuclear waste. Radium is the most important radioactive waste product and is a health hazard in drinking water.

Thermal Discharges

  • Heat is a water pollutant because it reduces the capacity of water to carry dissolved oxygen and raises the rate of metabolism in fish.
  • The practice of releasing cooling water from power stations into rivers is a major source of heat since the released water can be up to 15 degrees Celsius warmer than naturally occurring water.
  • Firstly, some fish species, such as trout, cannot survive in water with very low dissolved oxygen levels. Secondly, their eggs will not hatch at temperatures higher than 14.5 degree Celsius.
  • Moreover, there is a decline in oxygen saturation percentage with the increase in temperature.
  • Due to the density difference, hot water forms a separate layer above cold water.
  • This prevents the reaeration of the cold water underneath, as it has no atmospheric contact.
  • Due to the normal biological activities in the lower layer, the Dissolved Oxygen level falls rapidly and generates anaerobic conditions.

Oil

Every year, nearly half of the estimated 1 million tonnes of oil that enters marine habitats comes from land-based sources such as factories, farms, and towns. In addition, oil can ooze out from the ocean’s depths and eroded sedimentary rocks. Since oil does not dissolve in water and instead forms a thick sludge, it suffocates fish and sticks to the feathers of marine birds, preventing them from flying. Also, it prevents photosynthetic aquatic plants from receiving sunlight.

water pollution
water pollution

To sum up, the concentration of pollutants in water can be reduced by treating the effluents. To know more about wastewater treatment methods, please check our blogs, Wastewater Treatment- Stages and Process full details.