Air Pollution Meteorology and Plume Types

Air Pollution meteorology deals with the meteorological processes near to the earth’s surface. This consist of the impacts of meteorology on air pollutants and the effects of pollutants on meteorology. Air pollution meteorology studies how meteorological conditions affect the dispersion and behavior of pollutants. This field is crucial for understanding how various plume types—such as buoyant, neutral, and dense—interact with atmospheric conditions.

By analyzing air pollution meteorology, we can better grasp how factors like wind patterns, temperature inversions, and humidity influence plume behavior and air quality. Understanding these interactions helps predict pollution dispersion and mitigate its impact on health and the environment. With insights into types of plumes and their behavior, we can develop more effective strategies for managing and reducing air pollution.

In this blog, we will show you some important terms related to air pollution meteorology, environmental stability and types of plumes. 

  1. Significance of air pollution Meteorology
  2. Meteorological Factors affecting Air Pollution
    1. Wind speed and direction
    2. Temperature
    3. Humidity
    4. Rainfall
    5. Solar Radiation
  3. Lapse Rate in Air Pollution Meteorology
    1. Environmental Lapse Rate
    2. Adiabatic Lapse Rate
  4. Atmospheric Stability
  5. Types of Plume
    1. Coning Plume
    2. Fanning Plume
    3. Looping Plume
    4. Neutral Plume
    5. Lofting Plume
    6. Fumigating Plume
    7. Trapping Plume
  6. Key Takeaways
  7. Conclusion

Significance of air pollution Meteorology

If the air is still and pollutants are unable to disperse, the local concentration of pollutants will rise. Strong, turbulent winds, on the other hand, remove pollutants fast, resulting in reduced pollutant concentrations.

Thus, the destiny of air pollutants is influenced by air movements. As a result, any study of air pollution should also include a look at the weather patterns in the area that is meteorology.

The following are some of the benefits of analyzing meteorological data:

  1. Identify the source of pollution.
  2. Predict the occurrence of inversions and days with high pollutant concentrations.
  3. Simulate and predict air quality with the help of computer models.

Meteorological Factors affecting Air Pollution

Meteorological factors significantly influence air pollution meteorology by affecting plume behavior and dispersion. Wind speed and direction determine how different types of plumes—such as buoyant or dense—spread behave. Temperature inversions can trap pollutants, altering plume types and intensifying air pollution. Humidity and atmospheric pressure also impact the dispersion and behavior of pollutants, influencing overall air quality.

The following factors should be measured while examining air quality. They can help us better understand the chemical reactions that take place in the atmosphere.

  • Wind speed and direction
  • Temperature
  • Humidity
  • Rainfall
  • Solar Radiation

Also read Air Pollution Causes – A Comprehensive Guide

Wind speed and direction

Wind data records can be used to estimate the general direction and range of emissions when high pollutant concentrations occur at a monitoring station. Identifying the sources allows for the creation of a plan to decrease the negative effects on air quality.

In air pollution meteorology, wind speed and direction are crucial for plume behavior. High wind speeds can disperse pollutants widely. This affects various types of plumes. Calm conditions may lead to plume stagnation and localized air pollution. Understanding these factors helps predict air quality changes.

A large, multi-layered plume of smoke rising into the sky against a pale backdrop, showcasing different shades of gray and white.
Image depicting a large plume of smoke, illustrating the dispersion of pollutants in air pollution meteorology.

Temperature

Temperature measurement aids in the assessment, modelling, and forecasting of air quality. The chemical processes that occur in the atmosphere to generate photochemical smog from other pollutants are influenced by temperature and sunlight (solar radiation). 

Temperature influences air pollution meteorology by affecting plume behavior. Higher temperatures can enhance plume rise, dispersing pollutants more effectively. Conversely, temperature inversions trap pollutants near the ground, altering plume types and intensifying air pollution. Temperature variations thus play a key role in determining pollutant dispersion patterns.

Humidity

Water vapour plays a key role in a variety of thermal and photochemical reactions in the atmosphere. They can dramatically raise the amount of light scattered by particles suspended in the air if they are bound to particles . If corrosive gases, such as sulphur dioxide, bond to water molecules, the gas will dissolve in the water and generate an acid solution that can harm people and property.

Humidity impacts air pollution meteorology by affecting the size and behavior of pollutant plumes. High humidity can lead to the formation of secondary pollutants. It can also alter plume types. Low humidity may enhance pollutant dispersion. Understanding humidity’s role is essential for accurate air quality assessments.

Rainfall

When the rain washes particulate matter out of the atmosphere and dissolves gaseous contaminants, it has a scavenging effect. Visibility is improved by removing particulates. Also, when there is a lot of rain, the air quality is usually improved. Acid rain can arise when rain dissolves gaseous pollutants like sulphur dioxide, causing possible damage to objects and plant.

Rainfall affects air pollution meteorology by removing pollutants from the atmosphere through washout processes. It can change plume behavior, reducing pollutant concentrations in the air. The type and intensity of rainfall influence plume behavior. This impacts overall air quality and pollution levels.

Solar Radiation

Solar radiation must be monitored for use in modelling photochemical smog occurrences because the intensity of sunlight has a significant impact on the rate of chemical reactions that form smog. The intensity of sunlight is affected by cloudiness in the sky, time of day, and geographic location.

Solar radiation influences air pollution meteorology by driving chemical reactions in the atmosphere. It affects plume behavior by promoting the formation of secondary pollutants and influencing thermal patterns that impact plume types. Solar radiation’s role is crucial in understanding how different types of plumes disperse and interact with the environment.

Lapse Rate in Air Pollution Meteorology

The rate of change in the measured temperature as we move up through the Earth’s atmosphere is known as the lapse rate.

  • When the temperature drops with elevation, the lapse rate is positive.
  • It is zero when the temperature remains constant with elevation.
  • When the temperature rises with elevation the adiabatic lapse rate is negative. This is called temperature inversion.

Environmental Lapse Rate

The rate of decrease of temperature with altitude in the stationary atmosphere at a given time and location is known as the environmental lapse rate (ELR). The International Civil Aviation Organization (ICAO) has defined an international standard atmosphere (ISA) with a temperature lapse rate of 6.49 K/km (1.98 °C/1,000 ft) from sea level to 11 km.

                                   (dT/dz)env = -6.5 K / 1000 metres

The environmental lapse rate in air pollution meteorology affects plume behavior. It influences how different types of plumes rise or stay grounded. This impacts the dispersion and concentration of pollutants.

Adiabatic Lapse Rate

The adiabatic lapse rate (ALR) refers to the rate with which the temperature of an air parcel changes in response to compression or expansion associated with elevation change. This process is assumed to be adiabatic, that is, no heat exchange happens in between given air parcel and its surrounding.

                                       (dT/dz)adia  = -g/Cp = -9.86 0C / 1000 metres

Where,

                g = acceleration due to gravity

  Cp = Specific heat at constant pressure

The adiabatic lapse rate in air pollution meteorology defines how temperature changes with altitude for rising or descending plumes. This influences plume types and their dispersion characteristics and behavior.

Atmospheric Stability

The degree of atmospheric stability plays a key role in the ability of atmosphere to disperse the pollutants emitted to it. It is determined by comparing ELR and ALR.

When ELR = ALR, the atmosphere is neutrally stable.

If ELR > ALR, the atmosphere is superadiabatic and unstable.

When ELR < ALR, the atmosphere is subadiabatic and stable.

Under an unstable atmospheric condition, the lapse rate is super adiabatic. The actual temperature gradient is more negative than the dry adiabatic temperature gradient. A rising parcel of air gets warmer and tends to travel upwards due to increasing buoyancy. Air from different altitudes mixes thoroughly. There is rapid dispersion of pollutants throughout the entire atmosphere. As a result, this is highly desirable in pollution prevention.

Under a stable atmospheric condition, the lapse rate is subadiabatic. In this condition, a rising parcel of air gets denser, cooler and tends to fall back. The vertical mixing is very less and the dispersion of pollutants is very slow.

Atmospheric stability in air pollution meteorology determines how air layers resist or promote vertical movement. This affects plume types and behavior. It also influences the dispersion and mixing of pollutants.

Types of Plume

A plume is a column of liquid, gas, or dust that moves through another fluid, gas, or dust. The term plume is commonly used to describe things like smoke rising from a chimney. Depending on the degree of atmospherical instability, exit velocity from a stack and the prevailing wind turbulence, the plume emitted from a stack behave in different ways.

In air pollution meteorology, plume types refer to the behavior of pollutant emissions as they disperse in the atmosphere. Each plume type exhibits distinct behavior based on meteorological conditions, influencing how pollutants spread and affect air quality. Common types of plumes include….

  • Coning Plume
  • Fanning Plume
  • Looping Plume
  • Lofting Plume
  • Fumigating Plume
  • Trapping Plume

Let’s have a look at each one of them.
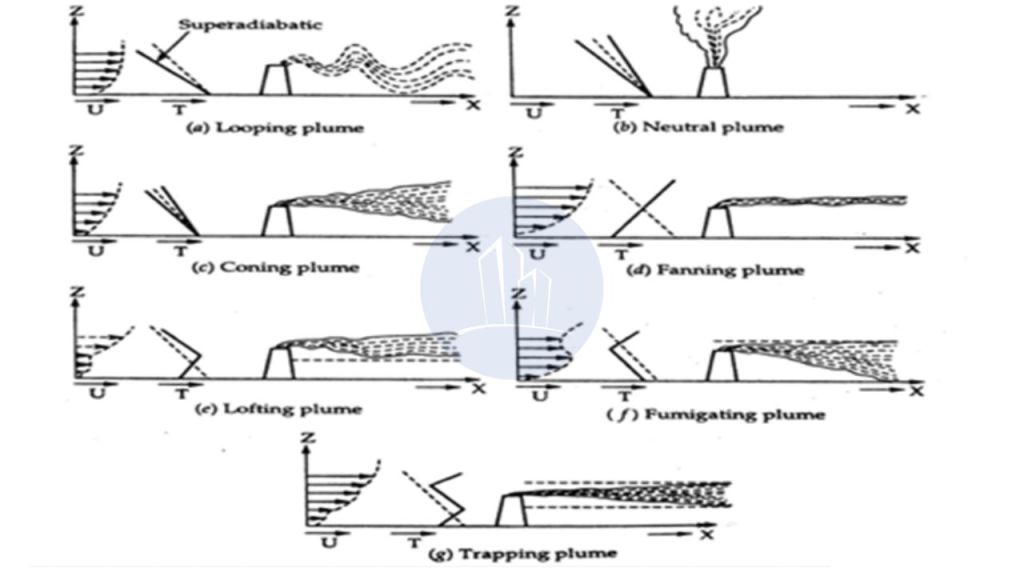
A large industrial facility with multiple smokestacks emitting white steam against a blue sky.
Industrial smokestacks releasing emissions into the atmosphere, illustrating the impact of air pollution on meteorology.
Diagram illustrating different types of plumes in air pollution meteorology, including looping, neutral, coning, fanning, lofting, fumigating, and trapping plumes.
Illustration of various types of plumes in air pollution meteorology, showcasing their behavior under different atmospheric conditions.

Coning Plume

In air pollution meteorology, a coning plume occurs when pollutant emissions disperse in a vertical cone shape. This plume type typically forms under neutral atmospheric conditions, where temperature and wind speed are relatively consistent with height. The coning plume’s symmetrical spread limits its horizontal dispersion, keeping pollutants concentrated near the emission source. Understanding this plume behaviour is crucial for predicting pollutant distribution in various meteorological scenarios, influencing air quality management strategies.

  • Formed when horizontal wind velocity exceeds 32 km/h and cloud blocks solar radiation during the day and terrestrial radiation during the night.
  • There is little vertical mixing.
  • The environment is slightly stable under sub-adiabatic conditions (ELR<ALR).
  • The plume shape is vertically symmetrical about the plume line.

Fanning Plume

In air pollution meteorology, a fanning plume occurs under stable atmospheric conditions. This happens where the environmental lapse rate is less than the adiabatic lapse rate.

A smoke stack emitting a plume of white smoke against a clear sky, illustrating air pollution in industrial environments.
A fanning plume disperses pollutants horizontally due to stable atmospheric conditions, common in air pollution meteorology.
  • Formed at extreme inversion conditions owing to a negative lapse rate.
  • When the environment is under conditions of inversion, a stable environment occurs just above the stack, and the plume moves horizontally rather than upwards. 
  • Occurs more frequently when there is less turbulence.
  • For high stack, fanning is considered a favourable meteorological condition as it doesn’t cause ground pollution.

Looping Plume

In air pollution meteorology, a looping plume forms under highly unstable conditions. The plume rises and falls. This leads to erratic pollutant dispersion.

A plume of smoke and vapor billowing from a tall industrial smokestack against a clear blue sky.
A looping plume of smoke emerges from a factory chimney, showcasing the erratic dispersion of pollutants in an unstable atmospheric condition.
  • The wavy looping plume arises in a super adiabatic environment (ELR>ALR). This results in a very unstable atmosphere due to rapid mixing.
  • In an unstable atmosphere, rapid vertical air motions occur both upward and downward, resulting in a looping plume.
  • As a result, large pollution concentrations may arise near the ground.
  • It is preferable to create high stacks where the environment is normally hyper adiabatic to scatter these contaminants.

Neutral Plume

In air pollution meteorology, a neutral plume occurs in neutral atmospheric conditions. In these conditions, plume behaviour is neither buoyant nor sinking. It maintains a steady dispersion.

  • In neutral atmospheric circumstances (ELR=ALR), a neutral plume forms. 
  • A neutral plume rises vertically in an upward direction.
  • The plume will continue to rise until it reaches a height where the density and temperature of the surrounding air are equal.

Lofting Plume

In air pollution meteorology, a lofting plume rises above a stable layer of air, enhancing dispersion. This plume type benefits from favorable plume behavior for pollutant spread.

  • Lofting plume is produced by a strong super adiabatic lapse rate immediately above the stack and a negative lapse rate (inversion) immediately below the stack opening.
  • The downward movement is stopped by inversion.
  • This results in a very rapid and turbulent upward mixing of the plume. But the downward mixing is less. 
  • As a result, the dispersion of pollutants becomes quick, and pollutants cannot come down to the ground.
  • Such a plume is good for dispersing air contaminants and providing significant protection to living beings.

Fumigating Plume

In air pollution meteorology, a fumigating plume descends from an inversion layer. This descent causes pollutants to concentrate near the ground. This illustrates adverse plume behavior.

  • The fumigant plume is the exact opposite of the lofting plume.
  • Formed when there is a negative lapse rate (inversion) just above the stack and a strong super adiabatic lapse rate below the stack.
  • Pollutants cannot escape above the stack under these conditions, thus they settle towards the ground due to turbulence and mixing.
  • As a result, the dispersion of contaminants in a fumigant plume is exceedingly poor.

Trapping Plume

In air pollution meteorology, a trapping plume occurs between two inversion layers. It confines pollutants within a specific altitude. This showcases a critical plume behavior.

  • When an inversion layer exists above and below the stack, the plume does not rise or fall.
  • Rather, it is constrained or trapped between the two inversion levels, resulting in a trapping plume.
  • This plume isn’t optimal for pollution dispersion since it can’t go past a particular height.

Key Takeaways

  1. Air Pollution Meteorology: Examines how meteorological conditions like wind, temperature, and humidity influence pollutant dispersion and plume behavior.
  2. Types of Plume: Include Coning, Fanning, Looping, Lofting, Fumigating, and Trapping, each behaving differently based on atmospheric stability.
  3. Plume Behavior: Influenced by factors such as wind speed. Temperature inversions and atmospheric pressure also play a role. These factors determine how pollutants spread and affect air quality.
  4. Environmental Stability: Plays a critical role in how plumes rise, disperse, or remain trapped, impacting overall pollution levels.
  5. Meteorological Analysis: Helps predict and mitigate pollution impacts by understanding plume dynamics under varying weather conditions.

Conclusion

Understanding Air Pollution Meteorology is essential for managing and reducing pollution’s impact on the environment and health. By analyzing the Types of Plume and their behavior, we can predict how pollutants will disperse under different meteorological conditions. The interaction between Plume Types and factors like wind, temperature, and atmospheric stability determines air quality outcomes. Effective strategies for pollution control rely on insights into Plume Behavior, enabling us to mitigate the adverse effects of air pollution. This knowledge is crucial for developing sustainable solutions to manage air quality and protect public health.

Air Pollution Causes and effects – A Comprehensive Guide

Air pollution killed approximately 1.7 million Indians in 2019, according to a report by the interdisciplinary journal Lancet Planetary Health. The causes of air pollution can be natural or man-made. Breathing fresh and pure air has become nearly impossible due to the increased quantity of contaminants in the air.

All of us are concerned about our health these days due to the rising level of air pollutants. Since the pollutants in the air are invisible to the human eye, we are unaware of the main sources of pollution. To understand the sources of air pollution, we must first identify the fundamental causes of air pollution.

In this blog, l will walk you through some common activities that knowingly or unknowingly are becoming the major causes of air pollution. Now, off we go.

Air pollution causes

Let me list down the 9 major causes of air pollution.

  • The Burning of Fossil Fuels
  • Agricultural Activities
  • Waste in Landfills
  • Industrial Emissions
  • Mining Operations
  • Natural Phenomena
  • Indoor Pollution
  • Construction and Demolition
  • Open Burning of Waste and stubble

Let’s have a look at each of them in detail.

Burning of Fossil Fuels – Chief cause of air pollution

  • Millions of diesel and gasoline-powered vehicles run on our roads daily.
  • Gasoline is composed mainly of hydrocarbons and trace amounts of nitrogen and sulphur bearing compounds.
  • The gasoline doesn’t undergo complete combustion always.
  • As a result, the exhaust gases coming out of gasoline-powered vehicles consists of harmful oxides of sulphur ( SO2, SO3), nitrogen (NOX), Particulate matter, carbon monoxide, etc.
  • PAHs, or polycyclic aromatic hydrocarbons, are also emitted from automobile exhaust.
  • When humans are exposed to large amounts of the same, it can harm their liver and lungs and even permanently destroy them.
  • It is not surprising that vehicular pollution contributes about 80% of nitrogen oxides and carbon monoxide in Delhi’s air.

Also read : Electric Vehicles- 5 Types & Advantages Full Guide

Agricultural Activities

  • Ammonia is the most common source of agricultural air pollution.
  • Heavily fertilised fields and livestock waste emit this gas in large amounts.
  • It combines with pollutants from combustion, primarily nitrogen oxides and sulphates from automobiles, power plants, and industrial operations, to form small solid particles known as aerosols.
  • They are little larger than 2.5 micrometres in diameter, or approximately 1/30 the width of a human hair.
  • These particles can get deep into the lungs and cause heart or lung diseases. 

Waste in Landfills

  • Garbage is buried or dumped into sites called Landfills.
  • Microbes act on these deposited or buried wastes and generate methane.
  • Methane is a significant greenhouse gas that is extremely combustible and dangerous.
  • It can form explosive mixtures along with air.

Industrial Emissions

Industrial activities release a variety of pollutants into the atmosphere, affecting air quality in ways we can’t even imagine. Industries that use coal and wood as their principal energy sources release PM 2.5 and 10, nitrogen dioxide, sulphur dioxide, and carbon monoxide.

Also read : Air Pollution Meteorology and Plume Types

Mining

Mining is one of the largest causes of air pollution. Excavations, blasting, and transportation of materials generate particulate matter. Also, Exhaust emissions from mobile sources such as trucks and heavy equipment raise these particulate levels.

Mining - A cause of Air Pollution
Mining – A cause of Air Pollution

Ever thought that there were natural causes of air pollution? Well, let me show you how this happens.

Natural Phenomena

  • Climate change is causing not only an increase in wildfires but also an increase in air pollution.
  • 0 -90% of wildfire smoke, by mass, lies within the particle size range of 2.5 micrometres in diameter or smaller.
  • PM 2.5 in the air combine with other dangerous chemicals, gases and pollen.
  • As a result, it causes smog.
  • Smog makes the air cloudy, making it difficult for people to breathe.
  • On warmer days, trees like Black gum, poplar, oak and willow emit substantial volumes of volatile organic compounds (VOCs) into the environment.
  • In addition, these VOCs combine with pollutants like NOx, SO2, and anthropogenic organic carbon compounds to form a seasonal haze of secondary pollutants.
  • Volcanic activity also produces pollutants like sulfur, chlorine, and ash particulates.

For a detailed insight on the major air pollutants, make sure that you go through our blog, What are air pollutants? | Types, sources and effects of air pollution.

Indoor Pollution – A hidden cause of air pollution

Have you ever observed that when you paint your house’s walls, it emits a noxious odour that makes it nearly impossible to breathe? This is due to the VOCs released by paints, perfumes, home decor, cleaning products etc. VOCs including acetone, formaldehyde, xylene, etc are chief causes of air pollution indoors.

Indoor Burning
Indoor Burning

Around 3 billion people still cook over open flames using solid fuels such as wood, crop wastes, charcoal, coal, and dung. These inefficient methods of cooking can release CO, CO2 and soot particles which can penetrate deep into the lungs. Above all, indoor smoke levels can be 100 times higher than permitted values in poorly ventilated houses. Shocking, right?

Here’s the truth. According to WHO, every year, around seven million people die prematurely as a result of the combined impacts of ambient (outdoor) and residential air pollution.

Also read : Waste water treatment – Stages and process

Construction and Demolition

Several construction sites and raw materials such as bricks and concrete produce haze and filthy air. This is endangering people, particularly children and the elderly. For instance, the Central Pollution Control Board (CPCB) recorded the highest number of air pollution complaints in the Delhi NCR due to building and demolition activity.

Open Burning of Waste and Stubble.

  • Garbage burning in the open is far more hazardous to your health and the environment than you might believe.
  • It is one of the major air pollution causes in Delhi along with the stubble burning by farmers.
  • Delhi produces 9500 tonnes of garbage each day, making it India’s second-largest waste dumping city.
  • Exposure to open rubbish burning poses a major health risk, including cancer, liver problems, immune system impairment, and reproductive dysfunction.

Causes of Air Pollution in Delhi

  • Firstly, the crop stubble burning by farmers of Punjab and Haryana contributes as much as 40% of Delhi’s air pollution in the winter months.
  • Secondly, construction activities add a great deal to the city’s pollution load. Dust from construction sites is responsible for 30% of air pollution in Delhi, according to authorities from the Delhi Pollution Control Committee (DPCC).
  • Automobile emissions and industrial pollution are also major contributors to poor air quality in Delhi.
  • A major source of airborne particulates in Delhi is a fire in the Bhalswa landfill.
  • Some other causes include cow dung cake combustion, fires on agricultural land, diesel generator exhaust, waste burning, and illicit industrial activity.

If you wish to dig deep into the pollution levels in Delhi, check out our blog, Air Quality Index in Delhi – AQI categories and Causes.

Conclusion

To sum up, air pollution has a variety of causes, each with its own set of problems. Residential energy for cooking and heating, vehicle emissions, electricity generation, agriculture/waste incineration, and industry are all major sources of air pollution. Integrated policies supporting sustainable land use, energy-efficient housing, power generation, and better municipal waste management can effectively reduce significant sources of ambient air pollution.

The National Green Tribunal has played a key role in delivering effective and timely resolution in cases involving environmental preservation, forest conservation, and air quality management. Let’s all be a part of reducing air pollution and do our bit to protect the air quality.

To know more about air pollution control measures, have a look at our blog, Air Pollution Control measures – Top 9 Air pollution control devices.

Environmental Impact Assessment (EIA) – Process and Benefits

Environmental Impact Assessment (EIA) is an indispensable part of any proposed project be it governmental or non-governmental. Environmental Impact Assessment is the method of assessing the possible environmental consequences of a proposed project or development.In this blog I will show you what is EIA, its procedure, benefits and shortcomings.

Read on to know more details.

What is Environmental Impact Assessment?

Environmental Impact Assessment is the method of assessing the possible environmental consequences of a proposed project or development. It takes into account both the positive and negative socioeconomic, cultural, and human-health consequences of the process. It is a mechanism used by the United Nations Environment Programme (UNEP) to determine the environmental, social, and economic impacts of a project before making a decision. The Environment Protection Act of 1986, which includes various provisions on EIA methodology and mechanism, provides legal backing for environmental impact assessments in India.

Environmental Impact Assessment (EIA)

Goals of Environmental Impact Assessment

Following are the goals of an EIA process:

  • Forecast environmental impacts early in the project planning and design process 
  • Identify ways to mitigate negative effects 
  • Tailor projects to suit the local community 
  • Present the predictions and options to decision-makers. 

Also readSustainable Cities -Features Full Guide

History of Environmental Impact Assessment in India

Environmental Impact Assessment has been practised in India for over 20 years. It began in 1976-77. In September 2006, the Ministry of Environment, Forests, and Climate Change (MoEFCC) announced new EIA legislation. The following projects require environmental clearance under the notification:

  • Mining
  • Thermal power plants, 
  • River valleys, 
  • Infrastructure (roads, highways, ports, harbours, and airports) 
  • Factories, including very small electroplating or foundry units

Also read : What is e-waste?

EIA Process

The steps outlined below are part of the EIA method. The EIA mechanism, is cyclical, with interactions between the various phases.

Screening: 

The project plan is scrutinised for its size, location, and form of construction, as well as whether it requires legislative approval.

Scoping: 

The project’s possible effects, impact zones, mitigation options, and monitoring requirements.

Collection of baseline data: 

Baseline data refers to the state of the environment in the study region.

Impact Prediction: 

Positive and negative, reversible and irreversible, transient and permanent effects must all be forecast. This requires the evaluation agency to provide a thorough understanding of the project.

Mitigation measures and the EIA report: 

The EIA report should provide actions and steps for avoiding, mitigating, or transferring the impacts, as well as the extent of compensation for likely environmental harm or loss.

Public Hearing: 

After the EIA report is completed, the public and environmental organisations residing near the project site will be advised and consulted.

Decision Making: 

The Impact Assessment Authority, in consultation with experts, consults the project manager and a consultant to make a final decision, holding EIA and EMP in mind (Environment Management Plan).

Monitoring and implementation of EMP: 

The various phases of implementation of the project are monitored.

Alternatives Evaluation and Environmental Impact Assessment Report:

Alternatives should be defined for each project, and environmental attributes should be compared. Both the project site and the process technology should be seen as alternatives.

Following the evaluation of alternatives, a mitigation plan for the chosen choice should be created, which should be supported by an Environmental Management Plan (EMP) to direct the supporter toward environmental improvements.

Risk Assessment: 

Inventory analysis and hazard likelihood and index are also used in EIA procedures.

Ever thought why all the projects must undergo the lengthy procedures of EIA? I have the answer for you. 

Environmental Impact Assessment (EIA)

Benefits of Environmental Impact Assessment

Ever thought why all the projects must undergo the lengthy procedures of EIA? I have the answer for you. 

  • Connects the environment and development for environmentally friendly and sustainable growth.
  • A cost-effective way to mitigate or reduce the negative effects of infrastructure projects.
  • Allows decision-makers to assess the impact of construction activities on the ecosystem well before the project is implemented.
  • Encourages the adaptation of mitigation techniques in the growth plan EIA ensures that the development strategy is environmentally sustainable and operates within the ecosystem’s capacity for assimilation and regeneration.

Cement tests – Laboratory tests and field tests

Cement tests are significant because cement is the most important and highly recognized binding material used in construction. Cement is an integral part of all types of construction ranging from huge skyscrapers, bridges, tunnels, etc to small residential buildings. For industrial structures like power plants, refineries, steel plants, cement plants, bridges, roads, etc. cement is the main component. Cement, when mixed with sand and aggregates, forms concrete and with sand makes mortar. The serviceability, strength, and durability of a structure are related to cement used in various works.

This article is about various tests conducted on cement to check its quality.

Cement tests – Categories

Cement is one of the oldest and most used binding materials and an integral ingredient used in the construction sector. The quality, serviceability, and stability of a structure are directly related to the quality of cement used in it. Hence it is required to analyse the quality of cement before using it for works. The tests for determining cement quality are split into two major categories.

Cement got physical as well as chemical properties. Normally lab tests are conducted to ascertain the properties of cement. Lab tests require time, special equipment, and professionals for testing and interpreting the results. It may not be possible to check all the properties of cement at the site. To overcome this difficulty cement tests are categorised into field tests and laboratory tests.

Cement tests

Field tests on Cement

The quality of cement is determined using some simple field tests. These tests do not require any sophisticated types of equipment and professional skills and get the results very quickly. By conducting these simple tests and analyzing the results we will get an idea about the cement quality and can immediately decide on accepting or rejecting it.
Following are the common field tests conducted to ensure the quality of cement.

These are first look tests and quality of cement is ensured by its smoothness to touch, the colour of cement, etc.

  • Checking manufacturing date
  • Visual checking of lumps
  • Feel test
  • Heat of cement
  • colour
  • Water float test
  • Setting test

These basic tests give an approximate characteristic of cement. These are easy and quick but not accurate, however help in concluding the acceptance of cement for works.

Also read : Field tests for cement

Laboratory tests for Cement

The laboratory tests are conducted to define the physical and chemical properties of cement. It is not possible to check all the cement properties at the site. The main laboratory tests conducted on cement is as follows.

  • Fineness Test
  • Compressive Strength Test
  • Consistency Test on cement
  • Setting time
  • Soundness Test
  • Tensile strength Test
  • Heat of hydration

Lab tests require time. But it provides accurate results.

Fineness test

The fineness test determines the size of the cement grains. Smaller the diameter of grains finer the cement is. Finer cement grains enhance the strength and cohesiveness of concrete.
The fineness of cement grains plays an important role in the hydration process and directly impacts the strength of concrete. Cement fineness is determined with the help of the following tests.

  • Sieve test
  • Blain’s air permeability test
  • Wagner turbidimeter method.

Blain’s air permeability test is the more reliable than sieve analysis test. The apparatus for this test is the permeability apparatus.

Finer cement grains above the permissible limits are also not preferred because excess finer grains increase the surface area. An increase in the surface area requires more water and results in the quick setting of cement. The standard guidelines for the Fineness test are IS 4031-PART1-1996, IS 4031(Part2)-1999, ASTM-204-05, ASTMC-115-96a (re-approved 2003).

Compressive Strength Test

The compressive strength of cement is the prime data to be determined before selecting the cement at the site. Concrete imparts strength to the structure and cement is the main ingredient in concrete. The apparatus for this test is a Compression testing machine. Gradual load is applied to the cement specimen. The load at which the specimen breaks and the area of the specimen define its strength. Certain factors like improper mixing, curing, proportioning, etc also affect the strength of cement. The cement with low compressive strength is not recommended in construction. The standard guidelines available for this test are IS4031 (Part 6)-1988, ASTM C 109, BS EN 196 – 1:2005.

Consistency test on cement

The consistency test is performed to determine the water necessary for attaining standard consistency or normal consistency. Water content is an important factor in making cement mortar. On mixing water with cement the chemical reaction or hydration is initiated. Excess water in cement results in an increase in the water-cement ratio. An increase in the water-cement ratio leads to a loss of strength when cement hardens. Less water content reduces the hydration process leads to loss of strength. Vicat apparatus is used to determine the consistency. The standard consistency of cement is when the Vicat plunger penetrates to a point 5 to 7 mm from the bottom of the Vicat mould. The consistency of cement ranges from 26% to 33%.

Vicats apparatus-Consistency test on cement

An increase in the amount of water content creates problems like bleeding, segregation in concrete. The standard guidelines about cement consistency are available in IS 4031 (Part 4)-1988, ASTM C 187, BS EN 196-3:2005, etc.

Setting time

Setting time is the time at which the cement hardens after gaining strength. It is necessary for the transportation, placing, and compaction of cement. The setting time of cement is measured at two stages – Initial and final. The time at which the setting begins is the initial setting time. At this stage, the cement loses its plasticity. The time at which the setting completes is the final setting time. This helps in the removal of scaffolding. We use the Vicat apparatus for determining setting time. The initial setting time of cement is 30 minutes and the final setting time is 600 minutes. The code which gives the guidelines about this test are IS 4031 (Part 5)-1988, ASTM C 191, BS EN 196-3:2005.

Soundness Test

A soundness test determines the capacity of cement to retain its volume after hardening. It also determines the additional lime present in the cement. Lime is one of the main ingredients of concrete. The deficiency of lime affects the setting time of cement. If the amount of lime is high, the cement will become unsound. Large expansion in the cement may produce cracks in concrete. Thus the disintegration, corrosion, and distortion occur in the concrete. So unsound cement should not be used in construction. This test can be done using the Le Chateler method and Autoclave method. The standard guidelines about this test are available in IS4031 (Part 3)-1988, ASTM C 151-09, BS EN 196-3: 2005.

Cement tests - Le Chatelier apparatus
Cement tests – Le Chatelier apparatus

Tensile strength Test

The tensile strength test is done using the Briquette test method or by the split tensile strength test. The tensile strength of cement is less compared to the compressive strength. Tensile cracking occurs due to dynamic loading and temperature variation. In this test, uni axial loading is done to determine the tensile strength. The standard guidelines for this test are available in ASTM C307 and EN 196-1.

Heat of Hydration

Hydration is an exothermic chemical reaction between cement and water involving the release of Heat. The hydration process increases the strength of cement. The heat of hydration is signified in terms of kilo joules per kilogram.
A calorimeter is an apparatus used for determining the hydration of cement. Important factors that influence the heat of hydration are the proportion of C3S and C3A, water-cement ratio, the curing temperature, fineness of cement, etc. An increase in heat of hydration produces undesirable stresses. The standard guidelines for this test are available in ASTM C 186 and IS4031 (Part 9 ) – 1988.

Conclusion

Tests on cement is the most essential activity to be included before starting any construction activity. The quality of cement determines the strength, serviceability, stability and life of a structure. Any compromise on quality can lead to serious construction defects and failures.

Splitting tensile strength test of concrete – Test procedure

The splitting tensile strength test is performed on hardened concrete to determine its tensile strength. Marginal variations in water to cement ratio, ingredient proportioning, increase in a slump, etc impacts the desired concrete strength. This in turn affects the strength and stability of structures. There are several tests to determine the strength of concrete.

Quality tests are to be conducted on concrete at various stages starting from the production stage to the hardened stage, and on structures. Quality tests play an important role in ensuring the construction quality. This article covers splitting tensile strength test for deriving the strength of concrete

Quality tests on concrete

The Quality tests are done on different stages like production stage, hardened stage and Non destructive tests.

Quality tests on Fresh concrete

Quality tests on hardened concrete

  • Compressive strength
  • Tensile strength – Split tensile strength
  • Flexural strength test
  • Water absorption test

Non destructive tests on concrete

In this article we deal with the Splitting tensile strength test of concrete.

Splitting tensile strength test – Significance

Since concrete is brittle, it is weak in tension and can cause cracks. So it is essential to conduct the tensile strength test of concrete. A method of determining the tensile strength of concrete using a cylinder which splits across the vertical diameter. It is an indirect method of testing tensile strength of concrete. At least three samples should be tested and an average value is calculated. The main objectives of this test are as follows

  • For determining the tensile strength of concrete.
  • To provide the information on the use of sand and aggregate.
  • To determine the uniform stress distribution.
  • For studying the behaviour of concrete.

Relevant code

  • IS 5816: 1999
  • ASTM C496
splitting tensile stress

Apparatus used

  • Testing machine
  • Plate or Supplementary Bearing bar
  • Bearing strips
  • Cylinder specimen
  • Tamping rod

The testing machine should apply continuous load without shocks. So for this test, two bearing strips with 3.2 mm thick and 25 mm wide are used. The dimension of the cylindrical specimen is 150 mm in diameter and 300 mm in height. 

Splitting tensile strength

Test procedure of Splitting tensile strength test

  • The first step is to prepare the concrete mix for making the cylindrical specimen.
  • Grease the inside surface of the mould and Pour the mix into the mould as layers.
  • Compact each layer using a tamping rod. Tap each layer 30 times. 
  • Uniformly stroke the concrete mix and remove the excess concrete.
  •  Then immerse the casted specimen in water for 24 hours at 27-degree celsius.
  • After that remove the specimen from the mould and immerse it in freshwater.
  • The splitting tensile strength of concrete should be conducted at 7, 28 days of curing.
  • Before starting the test, take the specimen from the immersed water and wipe the water. 
  • Then note the dimension and weight of the specimen. 
  • Place plywood strip above and below the specimen 
  • After that place the specimen on the testing machine. 
  • Then gradually apply load at a rate of 0.7 to 1.4 MPa/min (1.2 to 2.4 MPa/min based on IS 5816 1999).
  • Record the load at which the specimen breaks. 

Calculation – Splitting tensile strength test

Splitting tensile strength of concrete, T= 2P/ Ω LD

The unit of tensile strength is N/mm. The splitting test is easy to perform and we can get uniform results. It is a simple, reliable and convenient method to determine the strength of concrete.

Compressive strength test of concrete | Cube test for Concrete

Compressive strength of concrete is the ability of the concrete to withstand loads without cracking or deformation. Compressive Strength of concrete is defined as the Characteristic strength of 150 mm size concrete cubes @28 days.  Marginal variations in water to cement ratio, ingredient proportioning, increase in a slump, etc impacts the desired concrete strength which in turn affects the strength and stability of structures.

Quality tests are to be conducted on concrete at various stages starting from the production stage to the hardened stage, and on structures. Quality tests play an important role in ensuring the quality of a particular construction. This article covers the types of tests conducted on concrete at various stages.

Quality tests on concrete

Quality tests are done on different stages as listed below,

  • Production stage quality tests ( On fresh concrete before placing)
  • Hardened stage quality tests ( hardened concrete specimens)
  • On structures ( tests done on the structures )

Quality tests on Fresh concrete

Quality tests on hardened concrete

Non destructive tests on concrete

  • Rebound hammer
  • Penetration resistance test
  • Ultrasonic pulse velocity test

This article is about compressive strength test of concrete, its significance and procedure.

Compressive strength test of concrete – significance

As a construction material, concrete should be able to withstand heavy loads. The concrete material beneath compression tends to reduce its size. Concrete gains its strength over time. The compressive strength depends on cement strength, water-cement ratio, concrete quality etc. The test gives an idea of the overall strength and above-mentioned factors. Through conducting this test, one can easily judge the concrete strength and quality of concrete produced. We can calculate the compressive strength from the failure load and the cross-sectional area of the specimen.

Compressive strength test of concrete

Concrete compressive strength for general construction varies from 15 MPa (2200 psi) to 30 MPa (4400 psi) and more than that in case of commercial, industrial structures and special structures.

The compressive strength helps in determining

  • Quality control
  • Acceptance of concrete
  • Evaluation of curing
  • For determining the in-place concrete strength.
  • Age of concrete, etc.

Formula for compressive strength

Compressive strength formula for any material is the load applied at the point of failure to the cross-section area of the face of the concrete specimen (cube or cylinder) on which load was applied.

Compressive Strength = Load / Cross-sectional Area

Relevant IS code

IS: 516-1959

Apparatus used

  • Compression testing machine or Universal testing machine
  • Cube or cylinder specimen
  • Weighing machine
  • Vibrating machine
  • Trowel
Compression test - Apparatus

Compressive strength test of concrete

The specimen for this test can be cubic or cylindrical. The dimension of the specimens is as follows.

  • Cube = 150mm x 150mm x 150mm
  • Cylinder = 150mm diameter, 300mm height

The mould is made up of cast iron or steel. Cubical moulds are preferred for most works.

Compression testing of cubes – Procedure

Mixing of materials.

  • The first step is to prepare the test specimen by mixing the ingredients.
  • Mix the cement, coarse aggregate and fine aggregate in dry condition uniformly.
  • Mixing of the materials is by using batch mixer or by hand mixing.
  • Ingredients shall be bought to room temperature, before commencing the test.

Preparation of Test specimen

  • Clean the cube mould and apply the lubricant inside the mould.
  • Make at least three specimens from each batch.
  • After mixing the concrete, fill the specimen in the mould in three-layer at 50 mm thickness. 
  • After that stroke 35 times and compact the concrete using a vibrating machine. 
  • Then remove the excess concrete using a trowel. 
  • After that mark the date, grade of concrete etc and immerse the specimen in freshwater.
  • Then store the specimen at a temperature of 27-degree Celsius for 24 hours.

Procedure for testing

  • The specimens should be tested using the compression testing machine at 3, 7 and 28 days. 
  •  Before starting the test take the specimen from water and remove the mould.
  • The test should be conducted in the wet condition of the specimen.
  • Record the weight and dimension.
  • Then place the specimen in the testing machine. 
  • Gradually apply load on the specimen at a rate of 140 kg/ cm2 per minutes.
  • Note down the load at which the specimen breaks.
Compressive strength test of concrete

Calculation for Compressive strength test of concrete

The compressive strength of the concrete = Load at which the concrete breaks / Cross-sectional area of the specimen.

The compressive strength is expressed in N/mm2. The cube specimen is tested at 7, 14 & 28 days.

Calculation of compressive strength

Size of cube = 15cm x 15cm x 15cm

Area of specimen = 225 cm2

Expected maximum load = fck x area x f.s

Calculation shall be repeated for 7, and 28 days.

Results shall be furnished as average compressive strength of cube = …………… N/mm2 (7 days and 28 days)

Conclusion

The compressive strength of concrete cube gives and idea about the characteristics of concrete. With this single test we can judge the concrete quality and hence preferred for major construction works.

Updates in civil engineering, architecture finishes, building construction, Environmental Engineering